



Download PitchBook’s Report here.
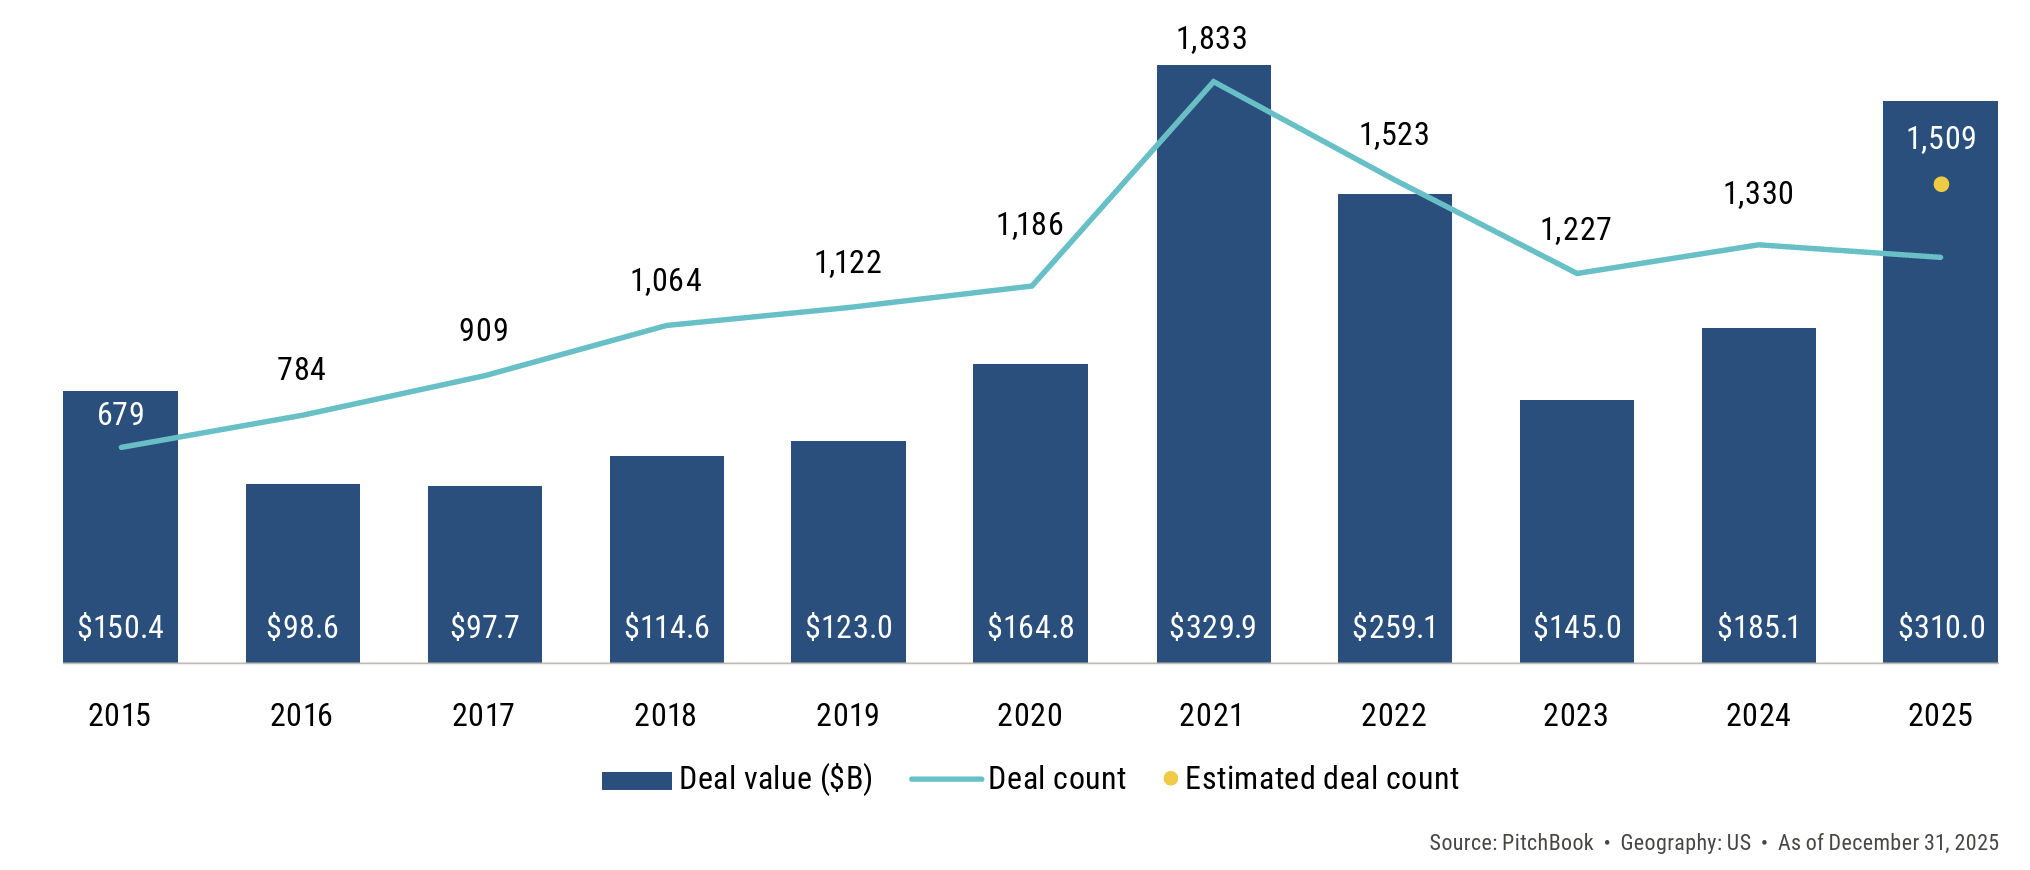
Technology PE deal activity experienced an outsized year, with deal value higher by 67.4% YoY even though deal count rose by a relatively more modest 13.4%. To put these numbers into context, total PE deal volume across all sectors rose 36.3% in 2025, while count increased by 5.9%. With an estimated 1,509 deals for a total of $310 billion, IT accounted for the secondgreatest share of total US PE deal activity, only behind B2B. Furthermore, IT achieved the second-greatest annual deal value ever, coming in just $20 billion below the record seen in 2021. The sector is well positioned in the current market landscape, driven by long-term megatrends such as AI and data-driven assets, as well as the continued digitalization of operations and supply chains. Software companies are highly attractive to investors given their recurring revenue models and high profit margins, defensible competitive moats, and ability to scale efficiently. Their relative insulation from tariff risk compared with other sectors further enhanced their appeal in 2025’s dealmaking environment.
(Past performance is no guarantee of future results.)





Latest news

Rate hike expectations ease as term SOFR curve flattens
The CME six-month Term SOFR rate reached a recent high of 3.979% on July 28 before retreating to 3.837% as…

3Q26: New loan assets rise to 44% of total lending, a 3-year high
New loan assets as a proportion of total US loan volume make up 44% of the 3Q26 pipeline to date,…

North American GPs dominant as fundraising accelerates
Our PEI Private Credit 200 ranking also shows capital raising increasing overall – and accelerating especially fast for the largest…