


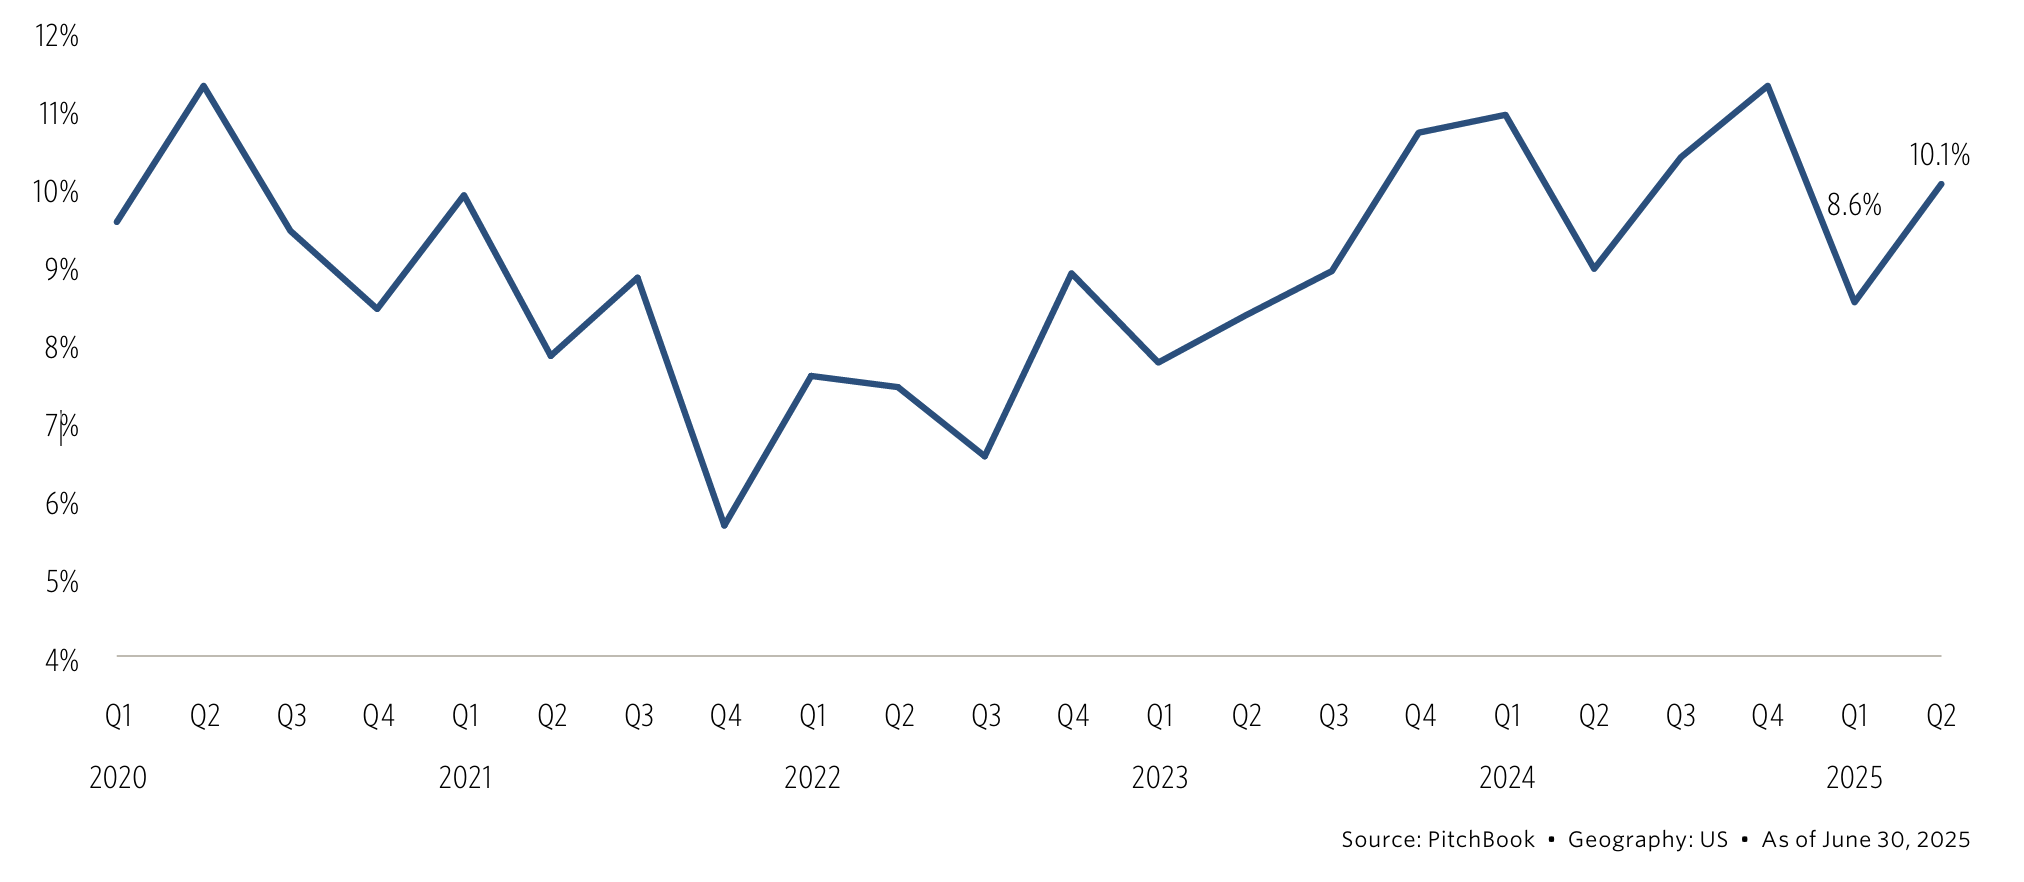
Carveout/divestiture count as a share of all PE middle-market buyout count by quarter

Download PitchBook’s Report here.
Carveouts remained a consistent feature of middle-market deal activity in Q2 2025. They accounted for 11.1% of deal value during the quarter, up from 10.9% in Q1 and broadly in line with the five-year annual average of 11.4%. On a transaction basis, carveouts represented 10.1% of deals, compared with 8.6% in the prior quarter and above the five-year annual average of 8.9%. While quarterly figures can fluctuate, annual trends provide a clearer benchmark. Industry participants note that many large companies are postponing spin-off activity until later in the year, awaiting greater policy clarity and more stable markets. These factors could drive stronger carveout activity in the second half of 2025. Carveouts provide compelling advantages for both buyers and sellers. For sellers, proceeds can be used to address maturing debt obligations or reinvest in higher-growth initiatives. For buyers, carveouts often involve established assets with robust financial histories, enabling more reliable due diligence. This transparency tends to attract a wider pool of bidders, reinforcing the appeal of carveouts in today’s dealmaking environment.
(Past performance is no guarantee of future results.)





Latest news

Lack of new issues clouds CLO market
It’s been boom time in the leveraged loan market but now that market has eased off, what are the implications…

Multiples on PE buyouts
This quarter marks our integration of SPI by StepStone as the primary source for US buyout valuation metrics for the PE Breakdown.

US Leveraged Loan Issuance Slows to $76.5b in July
The US leveraged loan market has continued to slow from the May level of $104.7b, with approximately $76.5b priced in…