



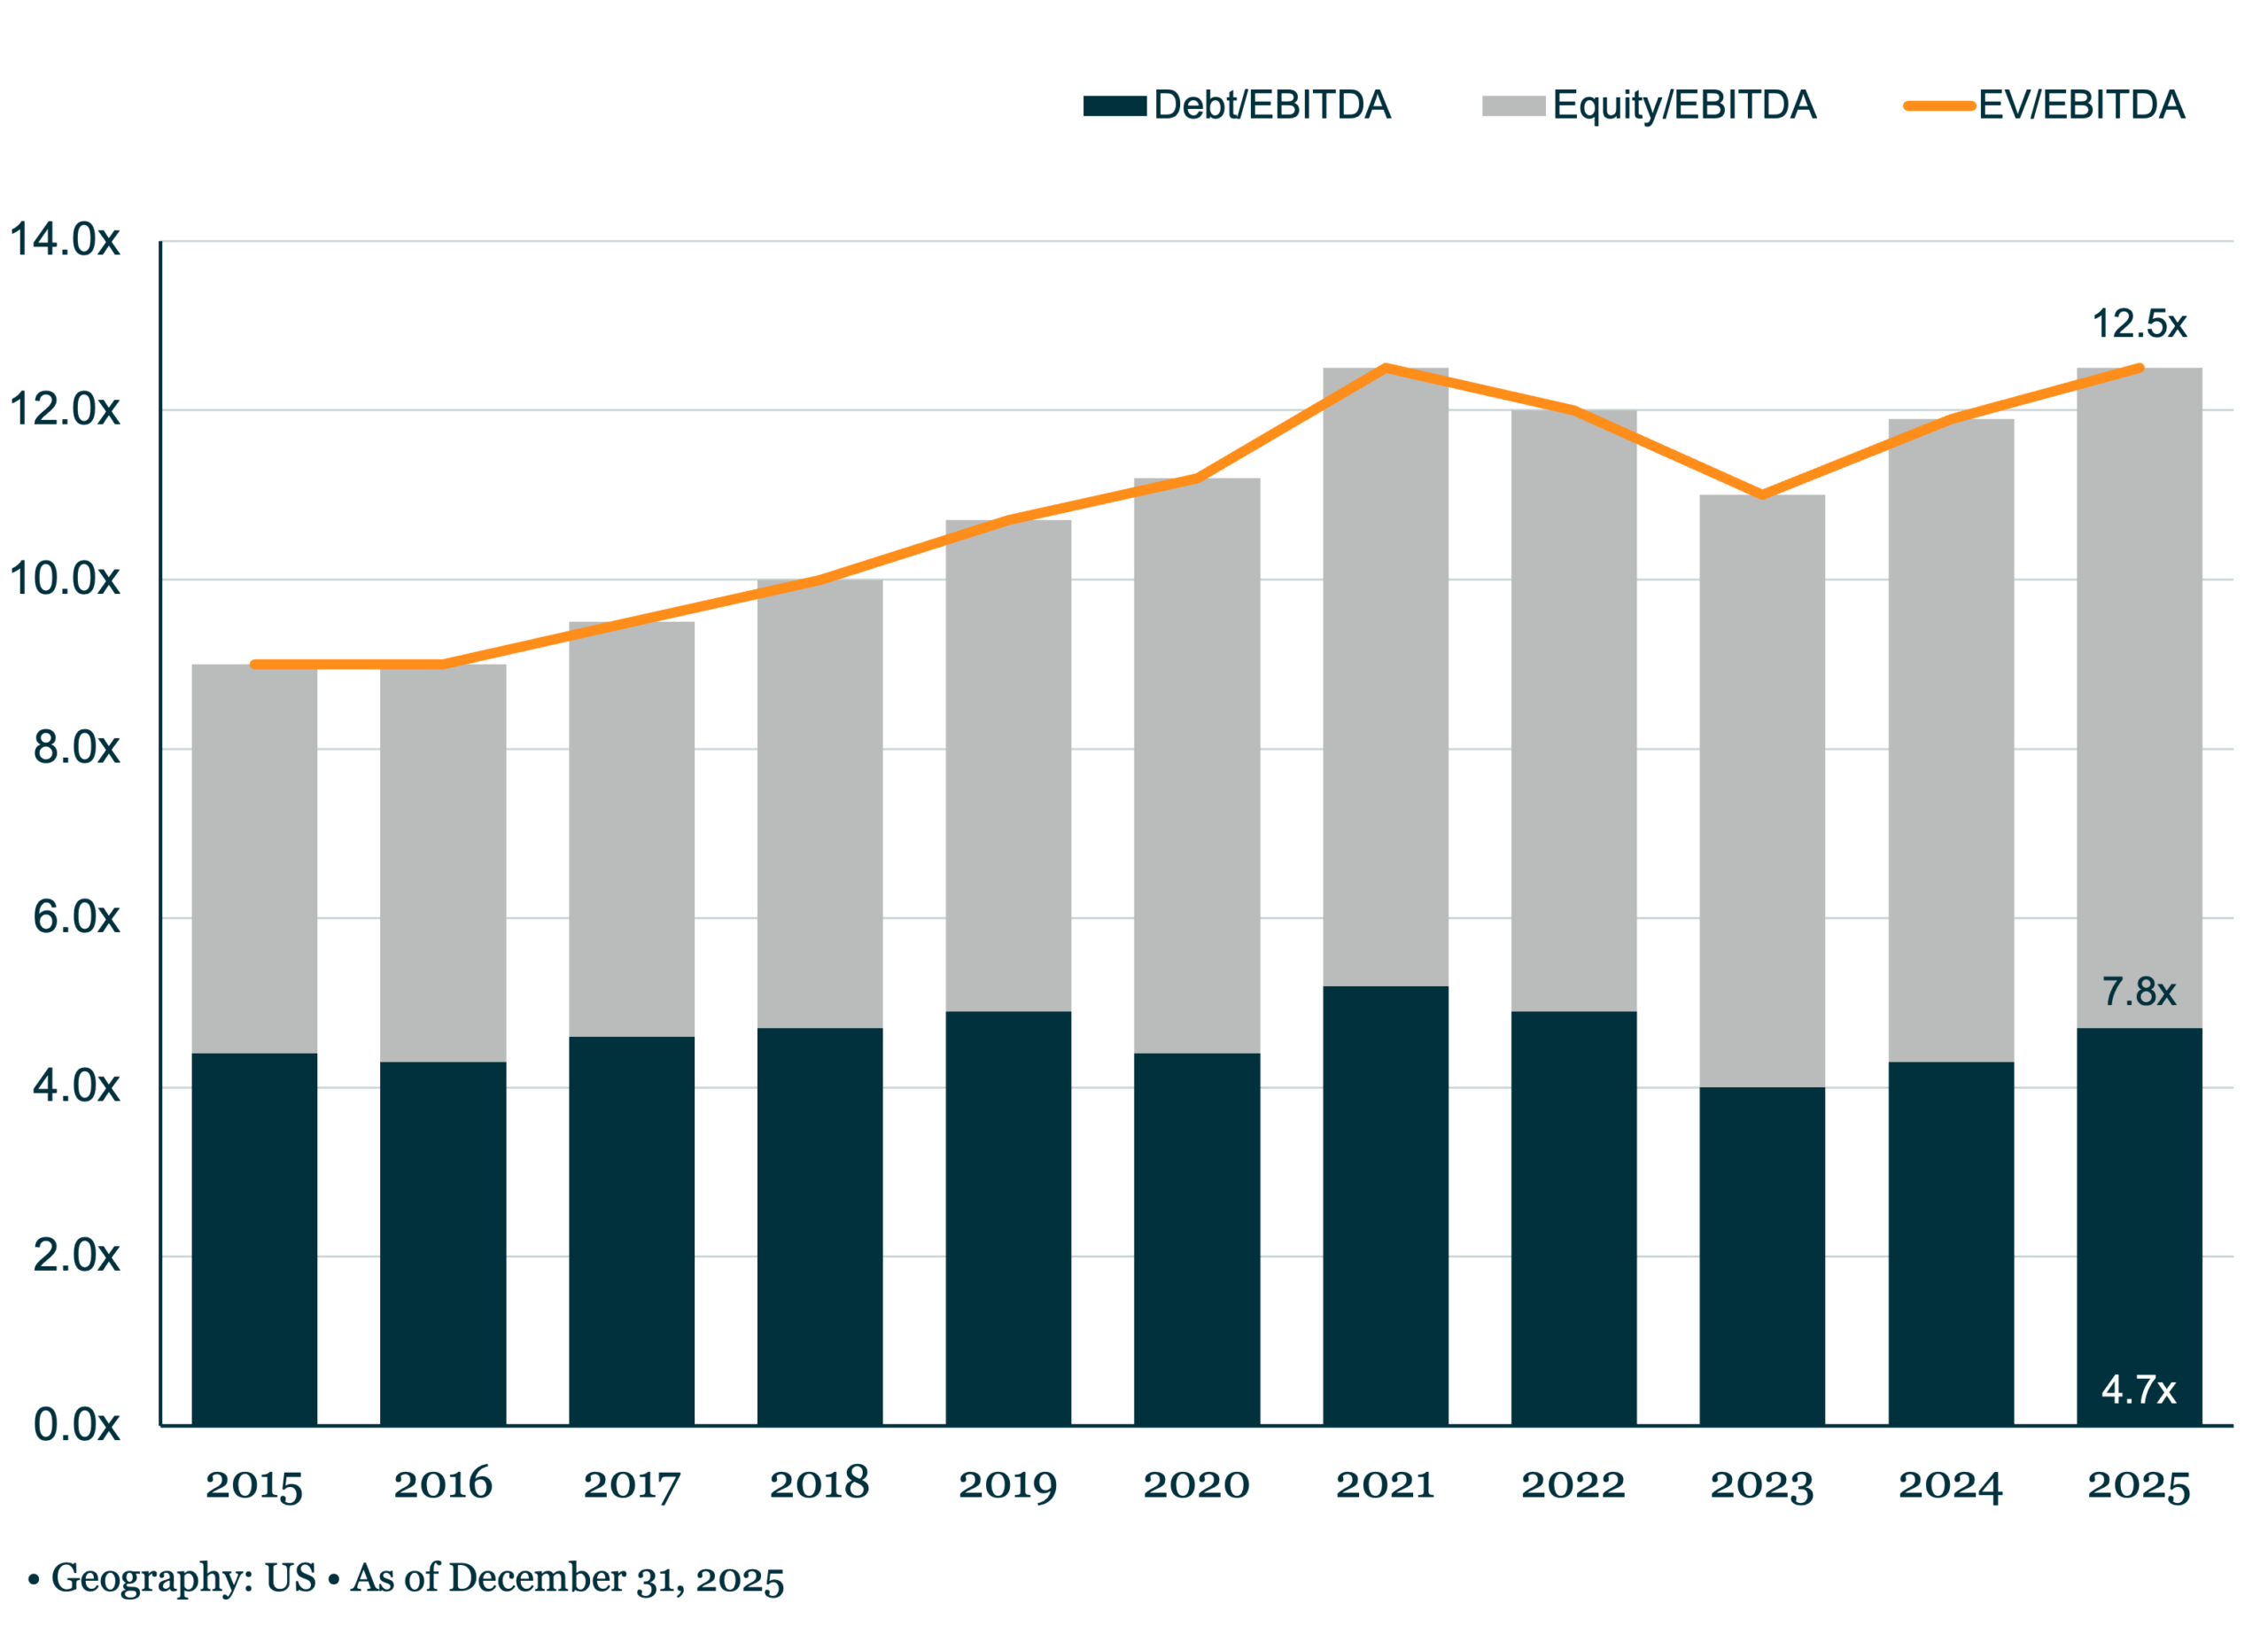
Source: SPI by StepStone.
Download PitchBook’s Report here.
This quarter marks our integration of SPI by StepStone as the primary source for US buyout valuation metrics for the PE Breakdown. SPI’s deal-level benchmarking allows us to decompose entry pricing, leverage, and value creation by size, sector, and vintage with a conviction that headline multiples alone cannot support. The floor under entry pricing has risen and stayed there. Median US buyout entry enterprise value (EV)/EBITDA closed 2025 at 12.5x, up from 9x in 2015 and level with the 2021 peak. US assets have run richer than the rest of the world in every year of the past decade, with 12.5x against 11.9x globally in 2025.Part of that step-up reflects what is clearing the market rather than pure inflation, since median EBITDA margins at entry have widened from 20.3% in 2015 to 23.3% in 2025. Sponsors, in short, are buying better businesses, not merely paying more for the same ones.





Latest news

Rate hike expectations ease as term SOFR curve flattens
The CME six-month Term SOFR rate reached a recent high of 3.979% on July 28 before retreating to 3.837% as…

3Q26: New loan assets rise to 44% of total lending, a 3-year high
New loan assets as a proportion of total US loan volume make up 44% of the 3Q26 pipeline to date,…

North American GPs dominant as fundraising accelerates
Our PEI Private Credit 200 ranking also shows capital raising increasing overall – and accelerating especially fast for the largest…