



As part of a series of data-focused observations around private debt performance, we look at DPIs going back to 2010.
PEI Group has harnessed its research and editorial strengths to begin producing quarterly Fund Performance Reports for all the alternative asset classes we cover – the first of these may be found here.
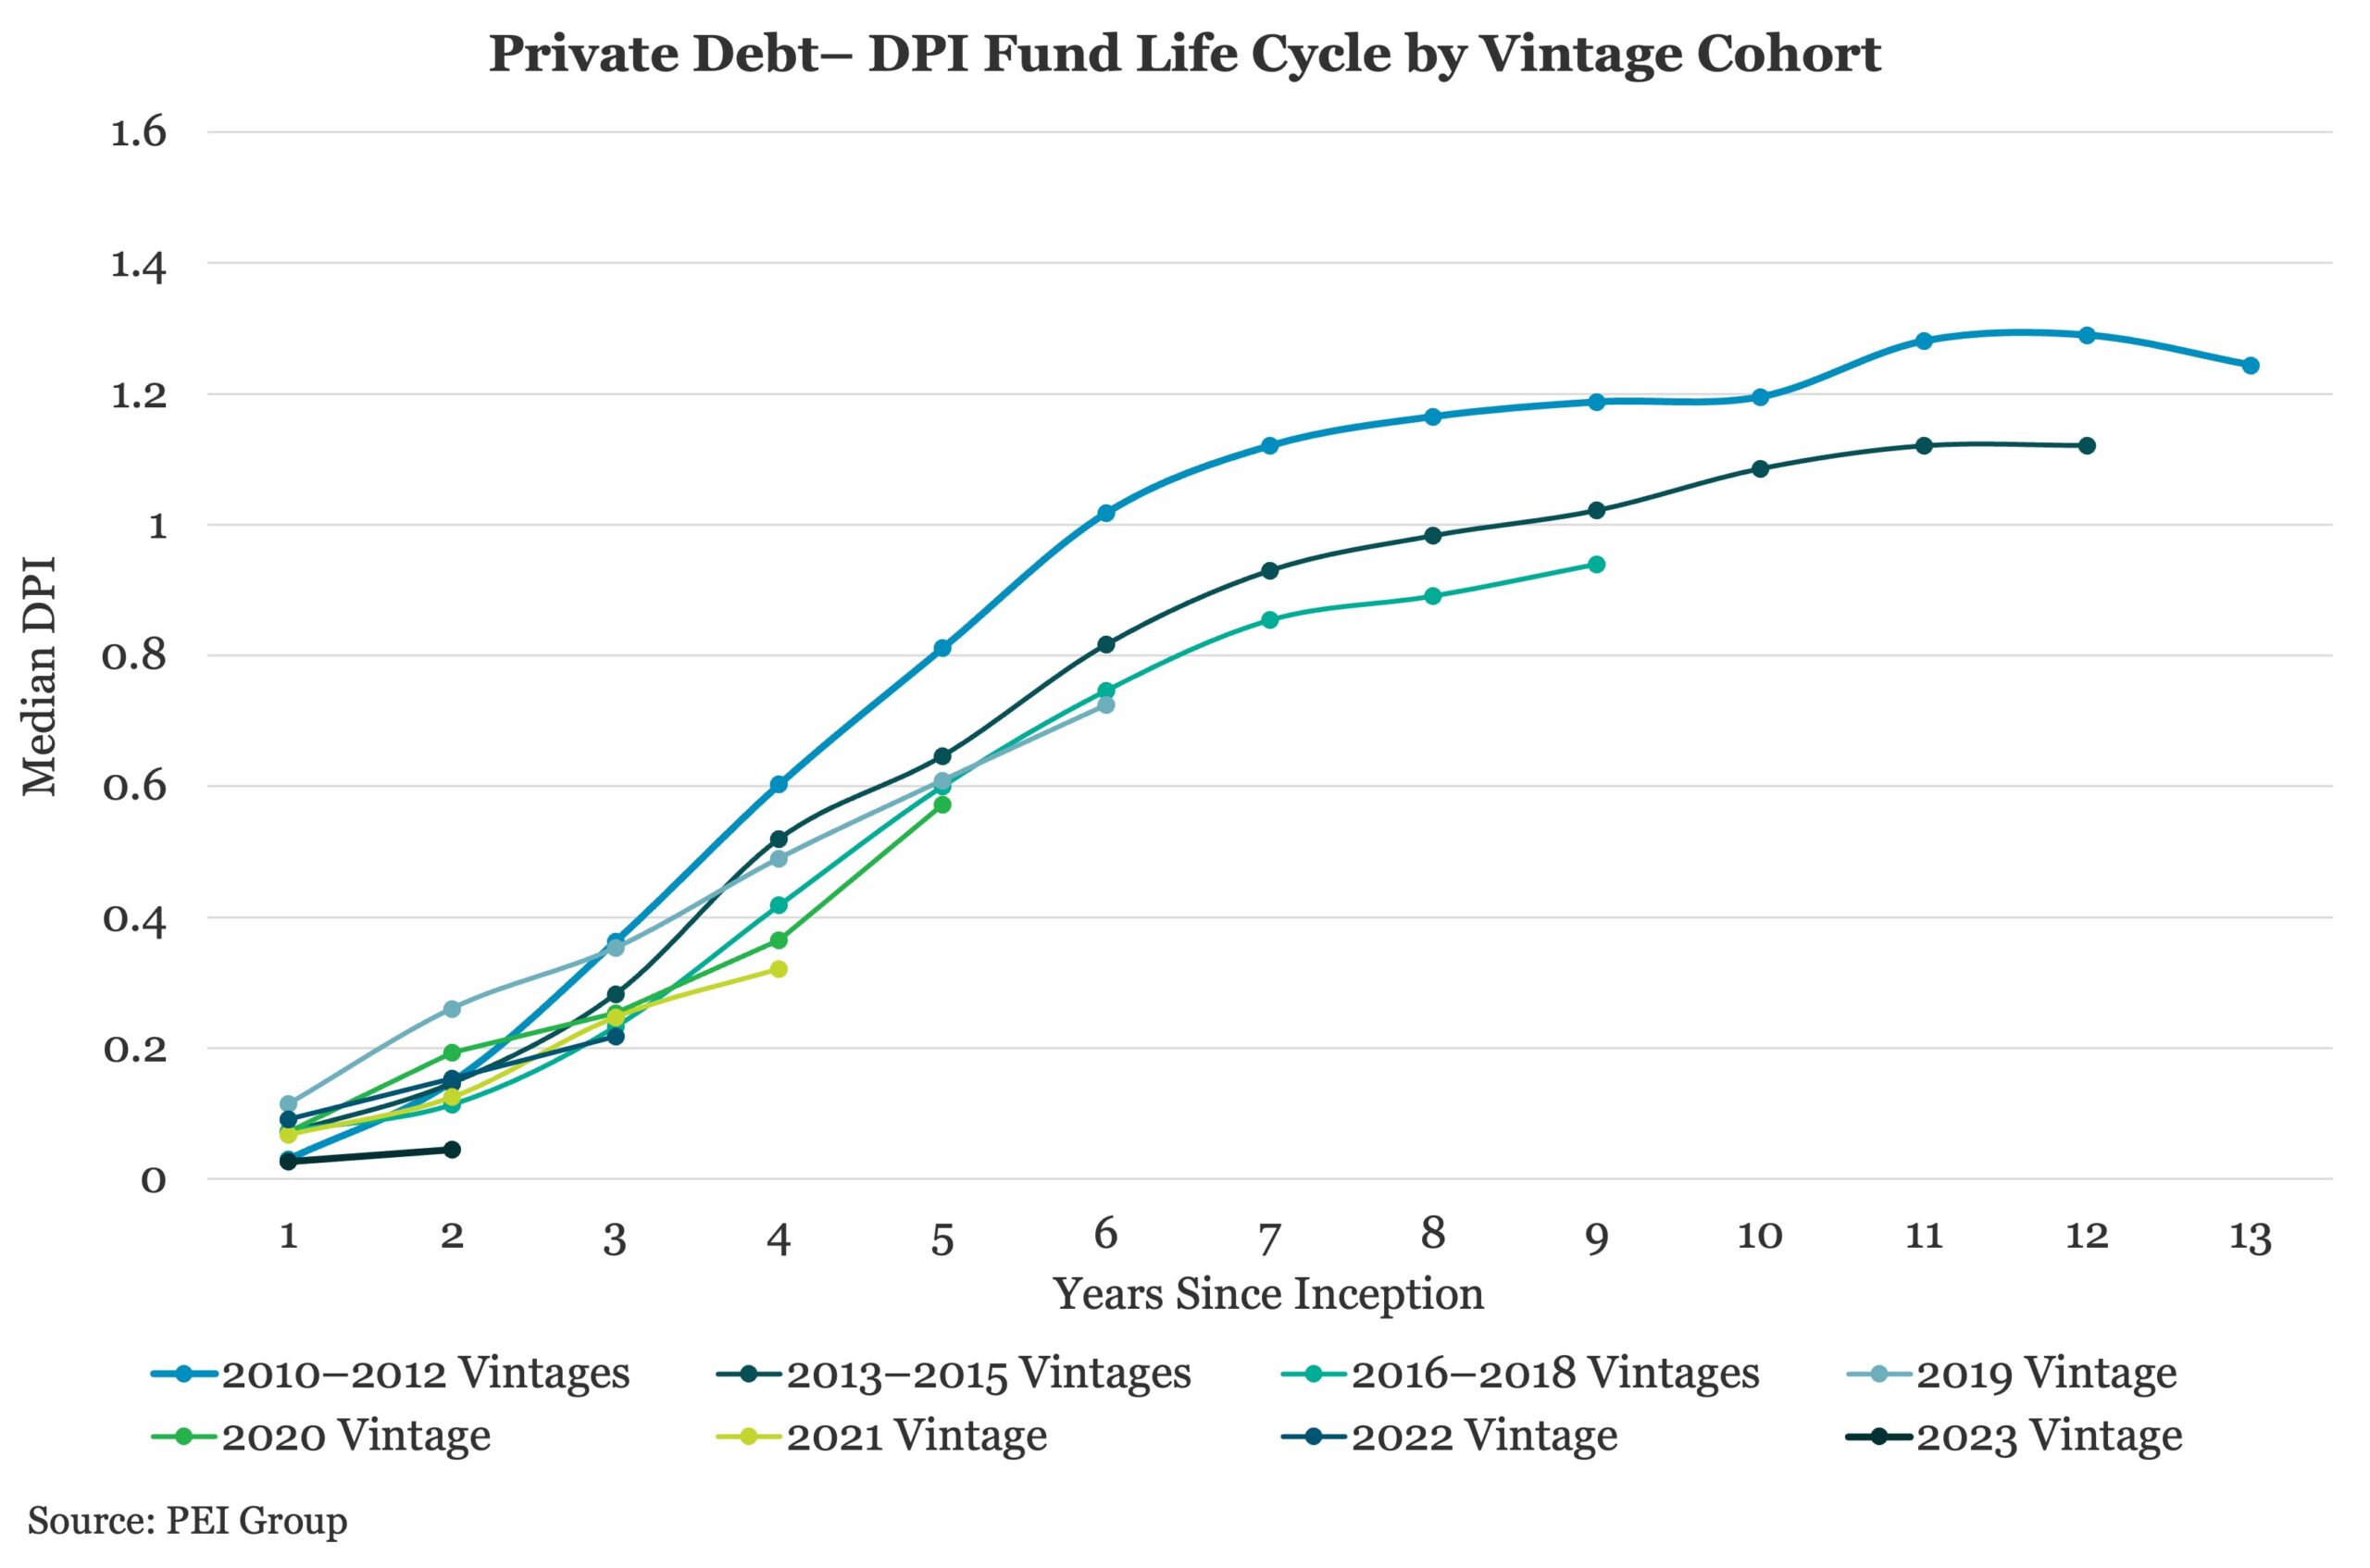
We will be bringing you key insights from our inaugural report in the coming weeks, but to get started we report on private debt’s performance as measured by vintage and on the basis of distribution-to-paid-in capital (DPI) – see accompanying graph.
In the vintages that have progressed through sufficient life cycles to reach a fully formed conclusion, it appears that private debt is doing the job for investors that they would have hoped for at the outset – namely, moving beyond the “break even” point to deliver a reasonably strong return.
With the DPI “break even” being 1.0 – the point at which all capital invested has been returned – our graph shows 2010-12 vintages advancing to around 1.3x DPI between years 11 and 12. This may be considered a very healthy return for an asset class which doesn’t rely solely on capital appreciation to keep LPs happy – also offering, as it does, income generation and less risk than equity strategies.
Perhaps as a result of competitive pressures with more funds being raised and more new entrants in the market, the 2013-2015 vintages show a somewhat reduced – though still highly respectable – DPI of just under 1.2x at year 12. The 2016-2018 vintages are on course to see a further reduction in DPI, while still set to move beyond 1.0 over the next year or two.
The performance of later vintages is more speculative but they appear to be tracking more or less in line with those from 2013-2018, if perhaps a little lower.





Latest news

Rate hike expectations ease as term SOFR curve flattens
The CME six-month Term SOFR rate reached a recent high of 3.979% on July 28 before retreating to 3.837% as…

3Q26: New loan assets rise to 44% of total lending, a 3-year high
New loan assets as a proportion of total US loan volume make up 44% of the 3Q26 pipeline to date,…

North American GPs dominant as fundraising accelerates
Our PEI Private Credit 200 ranking also shows capital raising increasing overall – and accelerating especially fast for the largest…