



Loan mutual fund & ETF assets under management (AUM) finished October at $127 billion, their lowest level since June 2013, as investors continued to pull money from these funds and loan prices shifted lower. Loan funds AUM is down over 10% this year, and is now 27% off the record high of $174 billion set in March 2014. Loan fund share of outstanding institutional debt has fallen to 14% from a high of 23% recorded in 1Q14. 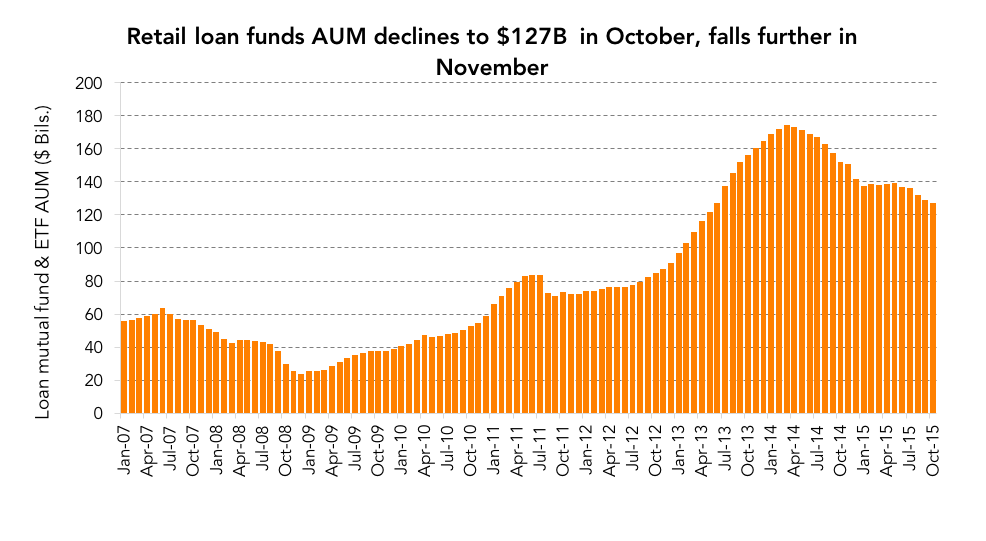 More recently, the outflows have continued this month, with nearly $1 billion exiting through November 18 (from funds that report flows on a weekly basis), according to Lipper, and outflows have been recorded in the last seventeen straight weeks. While expectations that the Federal Reserve will finally increase interest rates in December has gained traction, this has not translated into loans fund inflows. Contributing factors here include that recent weakness in the secondary market has pushed fund NAVs lower, negatively impacting returns. Also, the fact that most loans have Libor floors, which average around 1%, means that higher interest rates will not push returns higher until rates exceed the floors.
Contact: Colm Doherty
colm.doherty@thomsonreuters.com





Latest news

Rate hike expectations ease as term SOFR curve flattens
The CME six-month Term SOFR rate reached a recent high of 3.979% on July 28 before retreating to 3.837% as…

3Q26: New loan assets rise to 44% of total lending, a 3-year high
New loan assets as a proportion of total US loan volume make up 44% of the 3Q26 pipeline to date,…

North American GPs dominant as fundraising accelerates
Our PEI Private Credit 200 ranking also shows capital raising increasing overall – and accelerating especially fast for the largest…