



At $976 billion year to date, leveraged loan and high yield bond issuance is down 13 percent from the same period last year. However, 2013 was a record year driven by refinancing activity and this year’s figure is already ahead of any other full year on record with 2012’s $921 billion coming in closest. 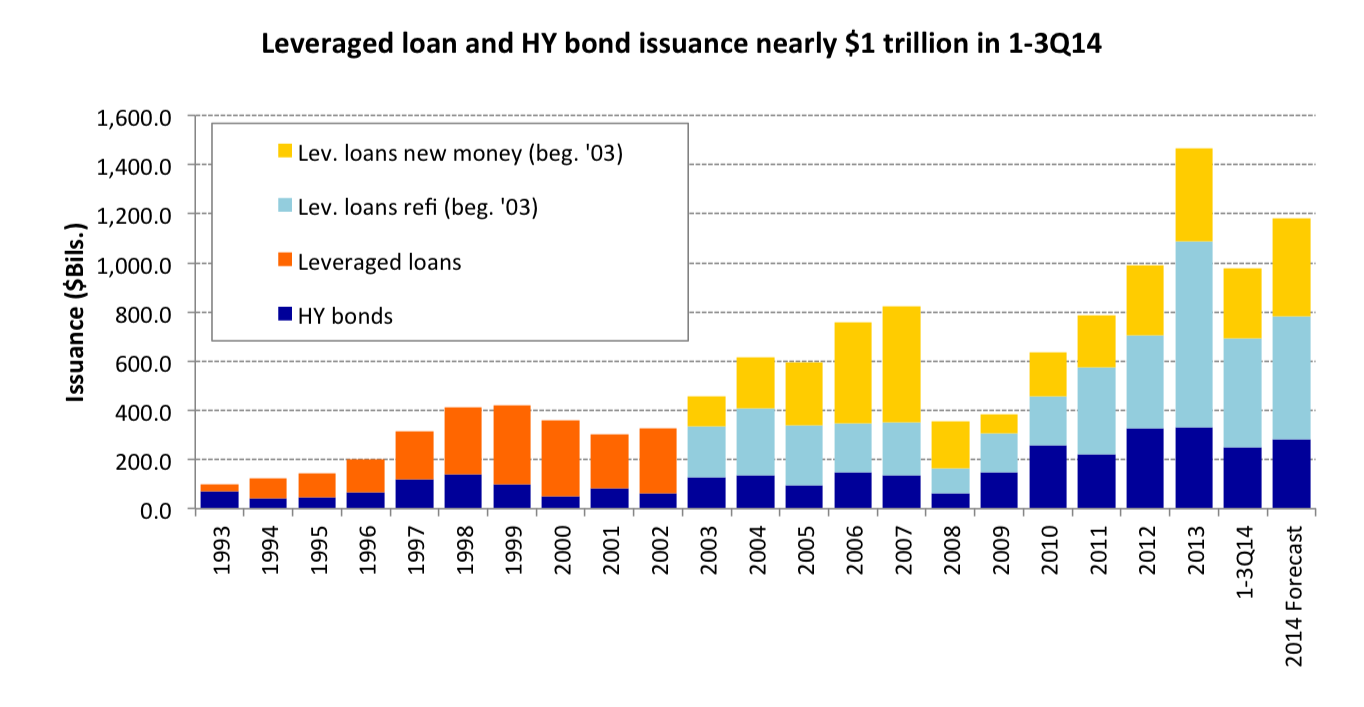 In contrast to 2013, the deal mix has improved to favor investors’ search for new assets which made up 40 percent of issuance so far this year compared to 30 percent at this time last year. At $288 billion, new money lending is up 7 percent compared to this time last year while leveraged loan refinancings are down 28 percent at $440 billion. Lenders expect that refinancings could reach $500 billion this year while new money could reach $350-$400 billion. Choppy markets on the back of geopolitical tensions and retail fund outflows led to a selloff in the secondary and a marked slowdown in primary issuance in the third quarter. High yield bond issuance was down nearly 40 percent to $68 billion while leveraged loan refinancings reached a two-year quarterly low with activity dropping 33 percent to $99 billion in the third quarter. Underliers





Latest news

Rate hike expectations ease as term SOFR curve flattens
The CME six-month Term SOFR rate reached a recent high of 3.979% on July 28 before retreating to 3.837% as…

3Q26: New loan assets rise to 44% of total lending, a 3-year high
New loan assets as a proportion of total US loan volume make up 44% of the 3Q26 pipeline to date,…

North American GPs dominant as fundraising accelerates
Our PEI Private Credit 200 ranking also shows capital raising increasing overall – and accelerating especially fast for the largest…