



Download PitchBook’s Report here.
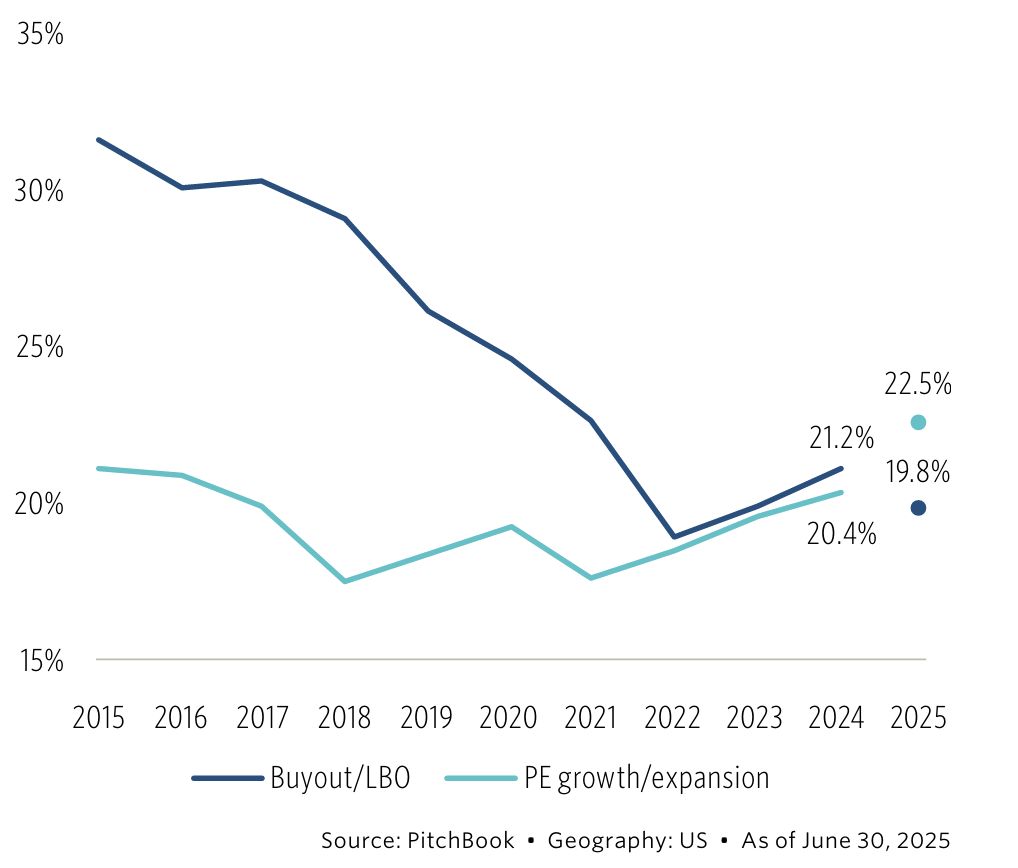
PE growth investment activity continues to be an important category, making up 22.3% of all PE deals in Q2, down 30 basis points from the prior quarter. This is modestly above the five-year average of 19.2%. With growth equity check sizes much smaller than buyout check sizes, growth equity’s share of overall PE deal value is always lower. In Q2, the share was quite low at only 8.3%, the lowest since Q2 2022 and 350 basis points under the five-year average of 11.8%. This shift was driven by the large-scale add-on transactions in the quarter, as further discussed below. These segments can be lumpy, and we expect to see a bounce back in the second half of the year. Growth equity’s distinctive playbook—favoring all-equity structures and steering clear of leverage—targets companies in growth mode. By injecting scale capital without saddling the balance sheet with debt, sponsors seek to further top-line growth and widen margins through operational rather than financial leverage. In a market that favors EBITDA accretion and disciplined cost control, that model remains compelling.
(Past performance is no guarantee of future results.)





Latest news

Rate hike expectations ease as term SOFR curve flattens
The CME six-month Term SOFR rate reached a recent high of 3.979% on July 28 before retreating to 3.837% as…

3Q26: New loan assets rise to 44% of total lending, a 3-year high
New loan assets as a proportion of total US loan volume make up 44% of the 3Q26 pipeline to date,…

North American GPs dominant as fundraising accelerates
Our PEI Private Credit 200 ranking also shows capital raising increasing overall – and accelerating especially fast for the largest…