



Download PitchBook’s Report here.
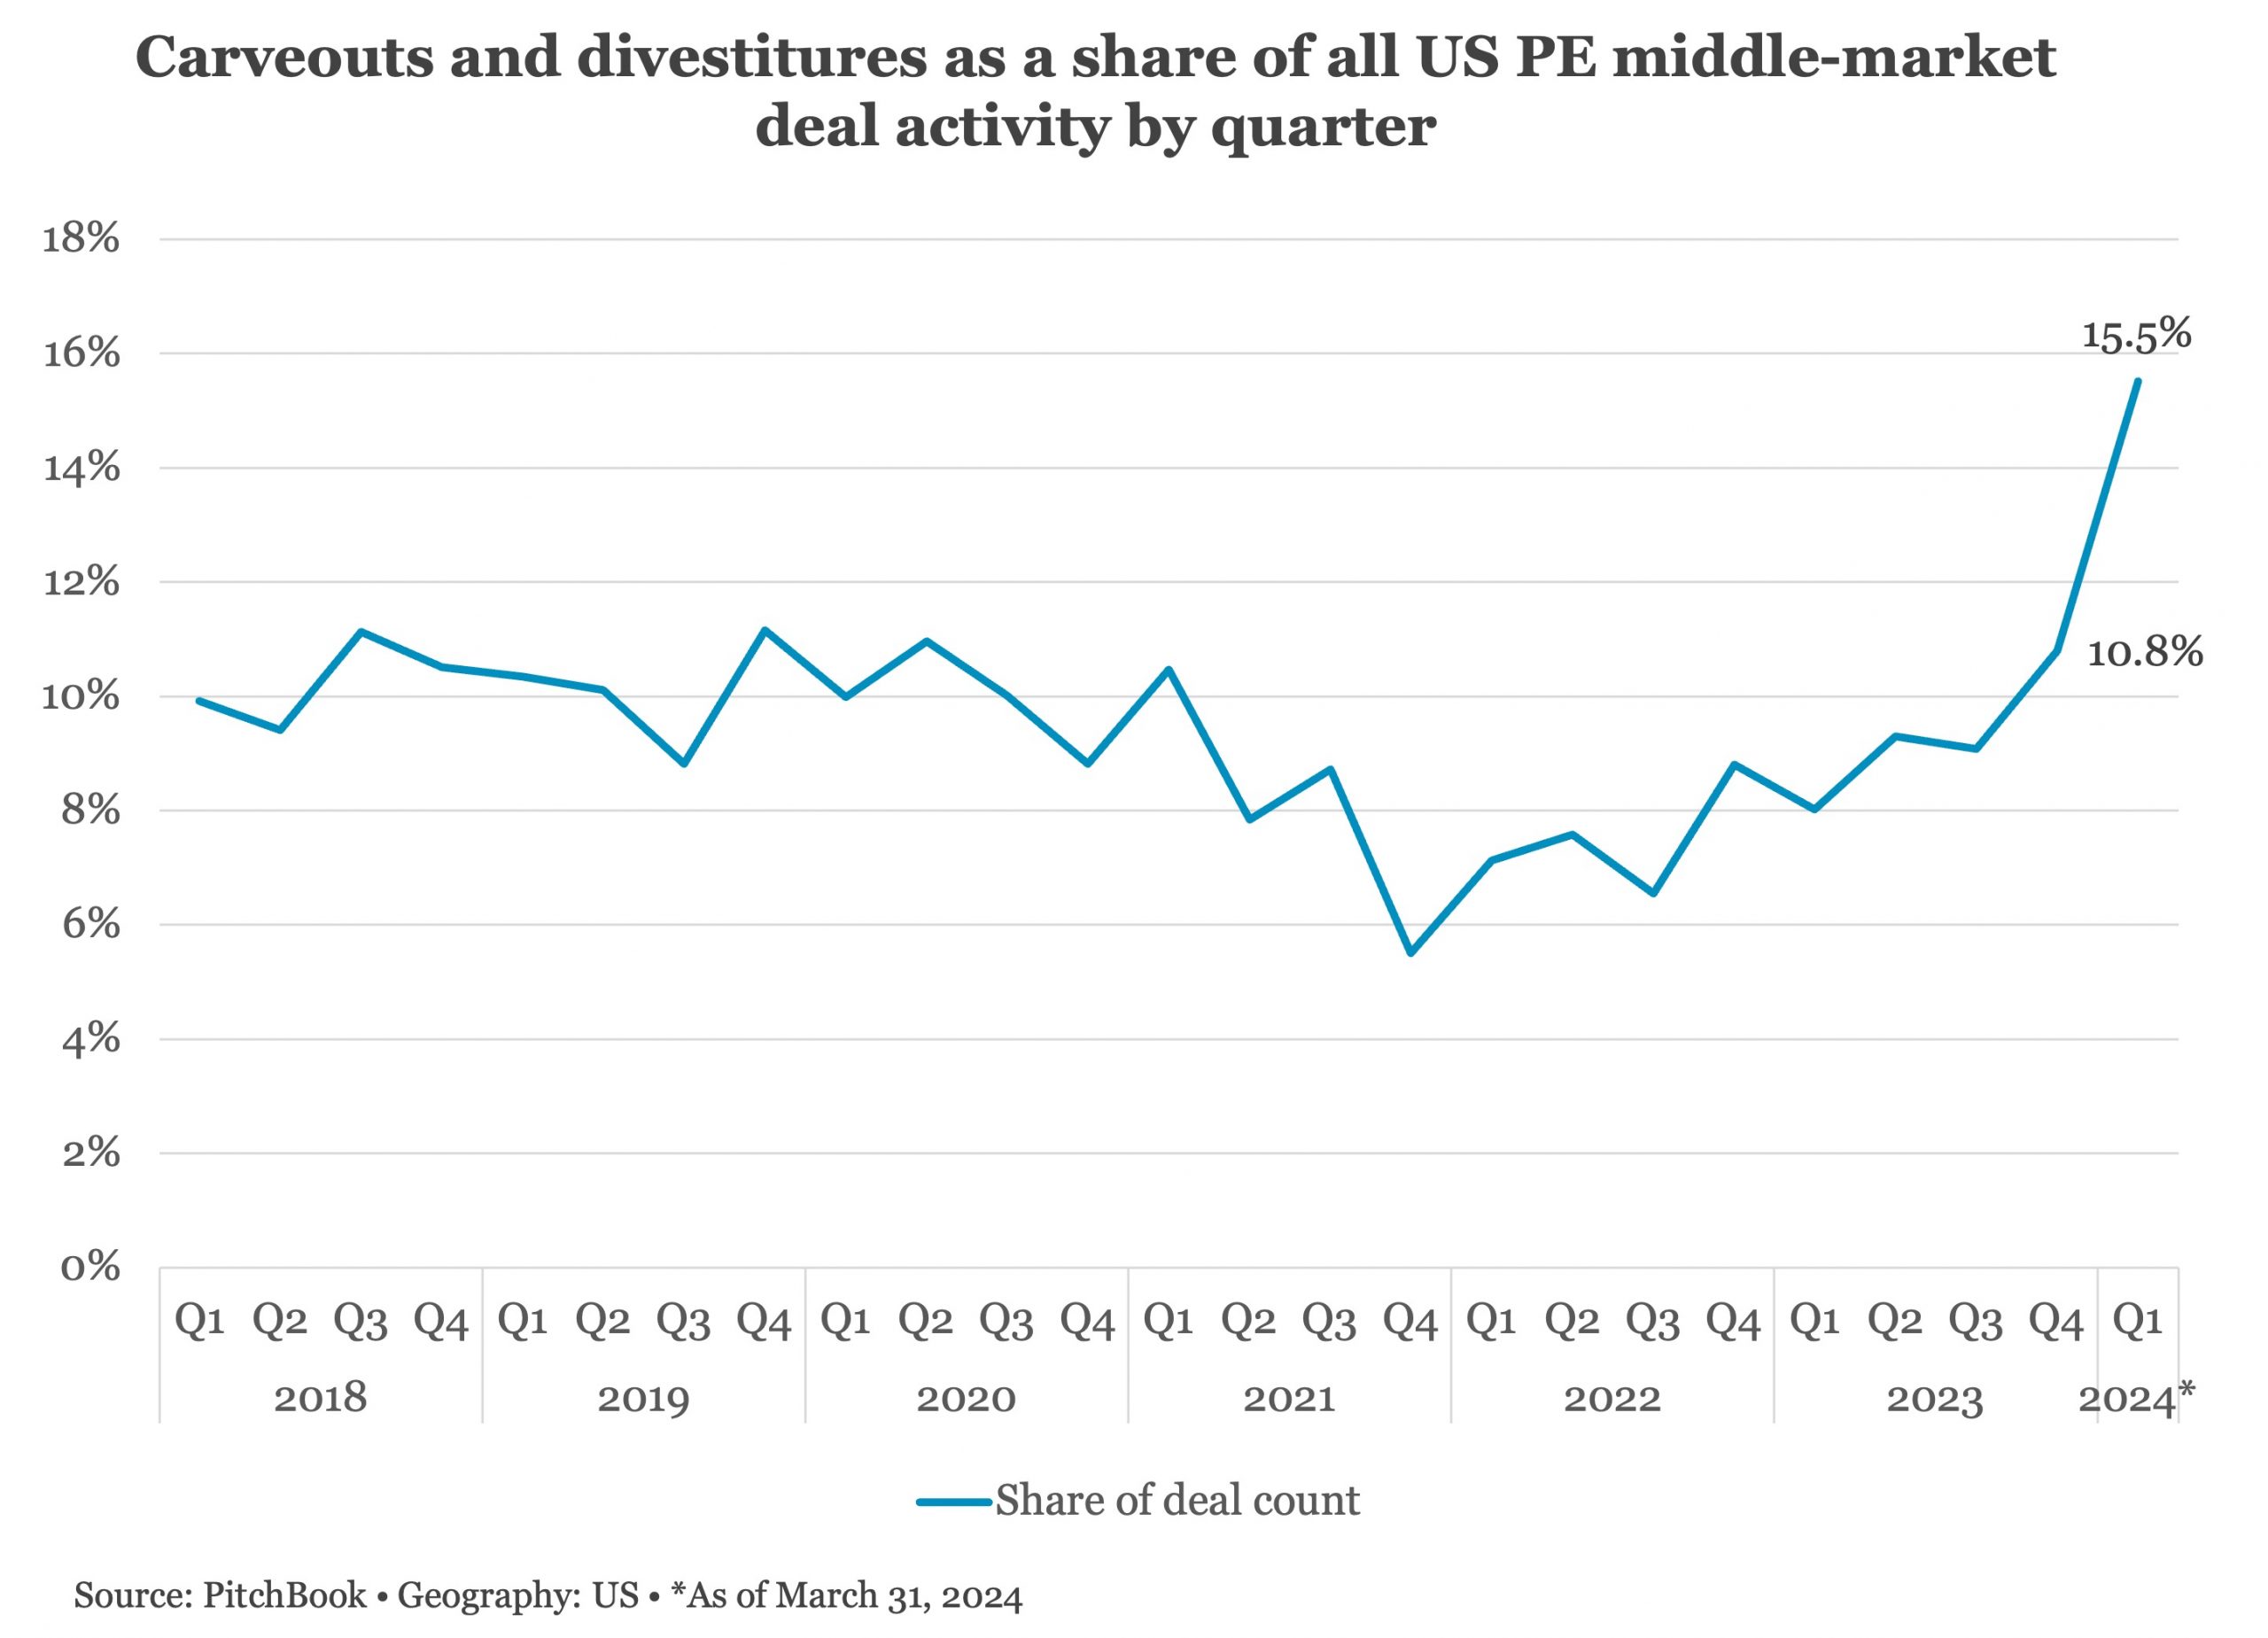
The share of carveouts in the deal landscape surged in Q1, representing 15.5% of the overall deal mix—the highest level since Q2 2013. This marks a significant increase from the recent low of 7.6% in 2022 and is well above the historical average of 12.1% from 2010 to 2020. The growing prominence of carveouts highlights their importance within the deal universe, especially in the current market characterized by a wide bid-ask spread. Carveouts provide sellers with a strategic opportunity to generate cash and enhance flexibility. This can be critical for paying down maturing debt or reallocating capital toward more promising ventures. These assets are typically well established and come with comprehensive historical financial data, facilitating thorough due diligence for acquirers and lenders. This transparency attracts a broader pool of bidders. From the seller’s perspective, while companies may have been reluctant to divest noncore assets amid the volatile markets of 2023, the outlook for 2024 appears more favorable.
(Past performance is no guarantee of future results.)





Latest news

Multiples on PE buyouts
This quarter marks our integration of SPI by StepStone as the primary source for US buyout valuation metrics for the PE Breakdown.

US Leveraged Loan Issuance Slows to $76.5b in July
The US leveraged loan market has continued to slow from the May level of $104.7b, with approximately $76.5b priced in…
