



Download PitchBook’s Report here.
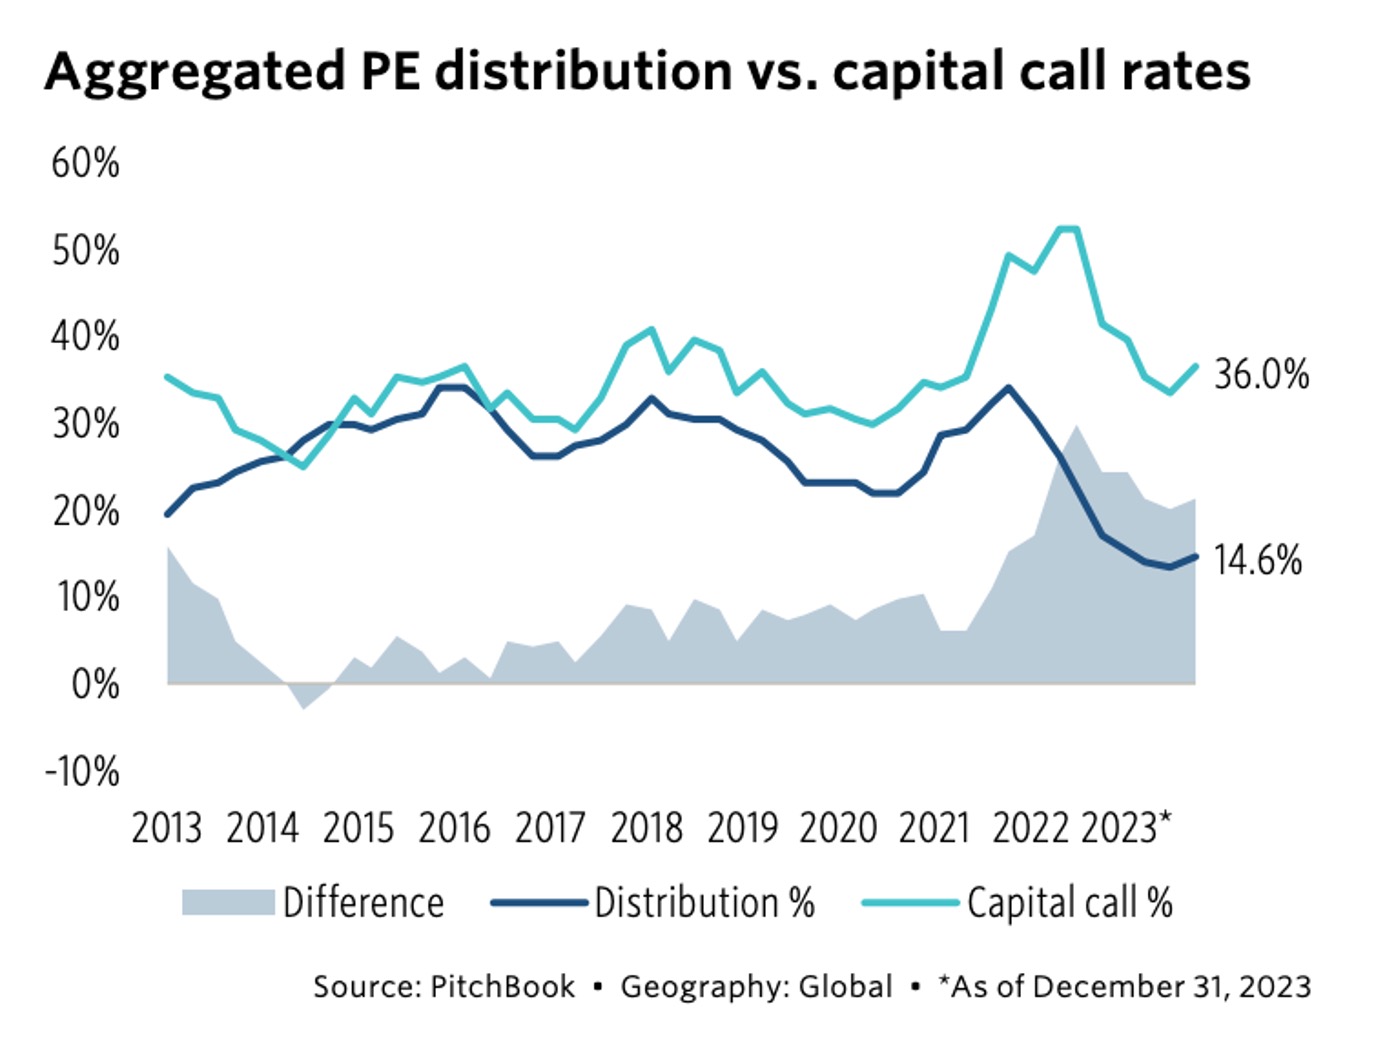
Unparalleled exit activity facilitated increases in 12-month distributions as a percentage of NAV for PE, culminating in a distribution rate of 33.7% in 2021, much higher than the historical average distribution of 24.4%. However, this spike did not result in a substantial payout of distributions to paid-in capital (DPI) back to the LPs of PE funds of recent vintages. To take advantage of the 2021 dealmaking frenzy, GPs ramped up their capital call activity, withdrawing capital from LPs at a much faster rate than was typical. The 12-month capital calls as a percentage of dry powder in 2021 came to 48.8%,3 a margin 14.1% higher than historical averages. As a result of these dynamics, although nominal net cash flows were marginally positive through 2021, they have been negative since the music stopped in 2022.
(Past performance is no guarantee of future results.)





Latest news

Multiples on PE buyouts
This quarter marks our integration of SPI by StepStone as the primary source for US buyout valuation metrics for the PE Breakdown.

US Leveraged Loan Issuance Slows to $76.5b in July
The US leveraged loan market has continued to slow from the May level of $104.7b, with approximately $76.5b priced in…
