



Download PitchBook’s Report here.
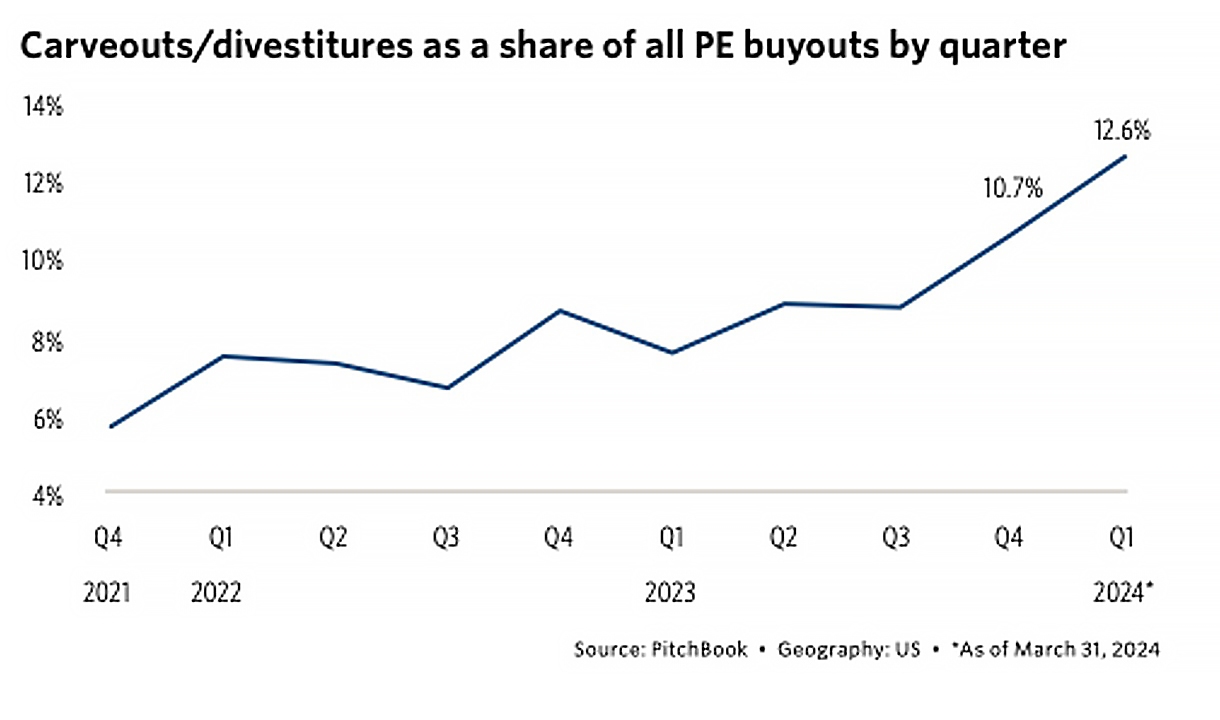
At the same time interest rates inflected upward for PE borrowers, earnings growth inflected downward for business owners and corporations. Earnings per share growth on S&P 500 companies has stagnated over the past two years, including three straight quarters of decline between Q4 2022 and Q2 2023 and three quarters of low-single-digit growth since then. For large companies tasked with achieving faster growth than the overall economy or peers, divestitures have always been a constant companion to the corporate strategist. When needing to kick growth into a higher gear, boardrooms can decide to either acquire what they do not own or divest what they do own. With growth rates as anemic as they have been over the past two years, this has caused more large companies to contemplate the latter, especially given the high cost of capital to fund a new purchase and the perceived likelihood of a recession. Large corporate owners were thus motivated to conserve cash and review what they own; at the same time, PE firms were more amenable to buying divested assets. With a more motivated universe of potential sellers, the bid-ask spread has been less disrupted than other areas of the M&A deal market.
(Past performance is no guarantee of future results.)





Latest news

Multiples on PE buyouts
This quarter marks our integration of SPI by StepStone as the primary source for US buyout valuation metrics for the PE Breakdown.

US Leveraged Loan Issuance Slows to $76.5b in July
The US leveraged loan market has continued to slow from the May level of $104.7b, with approximately $76.5b priced in…
