



High Tide for Secondary Buyouts
It isn’t too surprising that secondary buyouts (SBOs) hit a record by count in 2014. Globally, 707 SBOs closed last year valued at a combined $116.9 billion. The latter statistic is well off the record of $159.2 billion set in 2007, but by count 2014 saw 27% more sponsor-to-sponsor deals than 2007 and the height of the buyout boom.
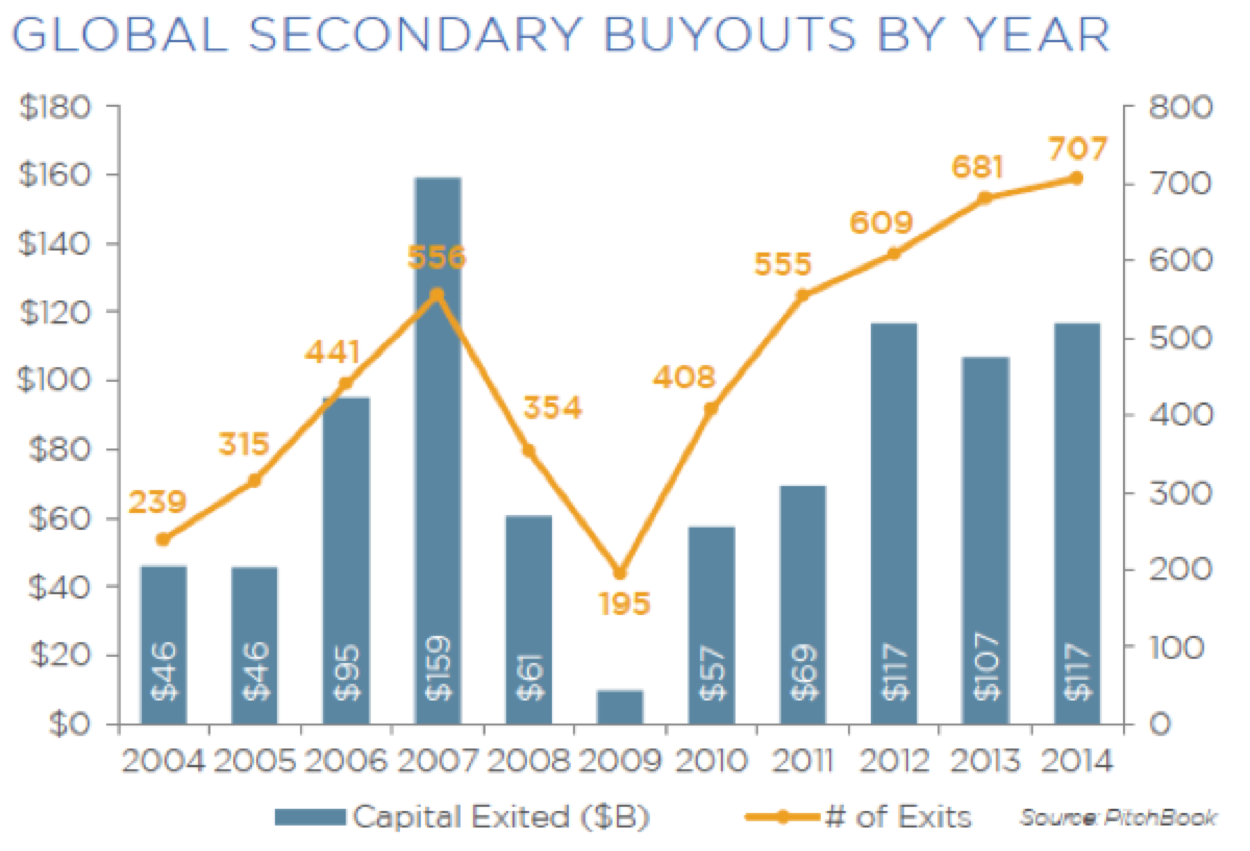
One of the big differences between 2014 and 2007 is the deal-making landscape, which has become much more difficult in recent years. Finding quality platform companies at reasonable valuations is much harder today, and SBOs are helping PE firms stay active in the market and put their always-growing dry powder levels to work. That might irk their LPs, which are funneling money back into the PE cycle only to find themselves buying and selling the same companies to themselves if they’re investors in both GPs. SBOs also hurt overall returns, with one research paper pegging the loss at $0.40 less cash per $1.00 invested and a 15% decline in IRR. In this environment, LPs might be a little more understanding about SBO levels, considering how much strategics are willing to bid for their acquisition targets. But LPs are probably chafing at the sizes of those SBOs, which hit a median of $295 million in 2014 as an exit size, up from $240 million in 2013 and $189 million in 2012.





Latest news

Rate hike expectations ease as term SOFR curve flattens
The CME six-month Term SOFR rate reached a recent high of 3.979% on July 28 before retreating to 3.837% as…

3Q26: New loan assets rise to 44% of total lending, a 3-year high
New loan assets as a proportion of total US loan volume make up 44% of the 3Q26 pipeline to date,…

North American GPs dominant as fundraising accelerates
Our PEI Private Credit 200 ranking also shows capital raising increasing overall – and accelerating especially fast for the largest…