



Download PitchBook’s Report here.
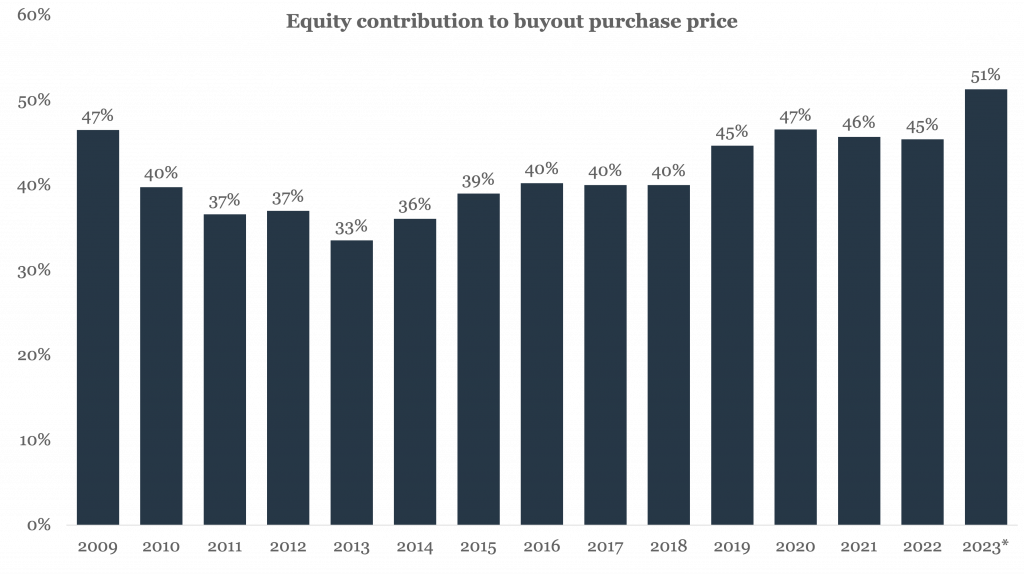
Buyout multiples have barely budged in 2023 and remain above the 11x threshold, according to PitchBook’s latest Quantitative Perspectives report, The Waiting Game. Facing a challenging lending market and stubborn price tags, equity contributions have had to increase as a result. None of this is surprising or controversial, but there is some symbolism weaved into the chart above. For the first time in PE’s history, equity contributions are currently breaching 50% for the year. It’s very close and could change by year end, but it would be a remarkable datapoint for an industry powered by leverage. At the same time, equity contributions have been in the 40-45% range for some time now. So the equity-to-debt breakdown has been closer to even than we may have assumed in the past. Still, going past the 50% mark for the first time is a big deal, even if its more symbolic and temporary than anything. The public’s perception of the LBO model goes as far back as the 1980s, when equity contributions could fall below 25%. Certainly not anymore.
(Past performance is no guarantee of future results.)



Latest news

US Leveraged Loans Return 3.36% to Investors YTD
The Bloomberg US Leveraged Loan Index (Ticker: LOAN) returned 0.96% in August and has gained an additional 0.28% through September…

PE dry powder
The capital that is being raised is flowing overwhelmingly to the largest, most established managers.

Middle market debt held by BDCs vs High yield vs Treasury yields
The blue line represents the current dividend yield of the VanEck BDC Income ETF (BIZD), which stood at 11.7% as…