



Is the PE industry on pace for lower net cash flows?
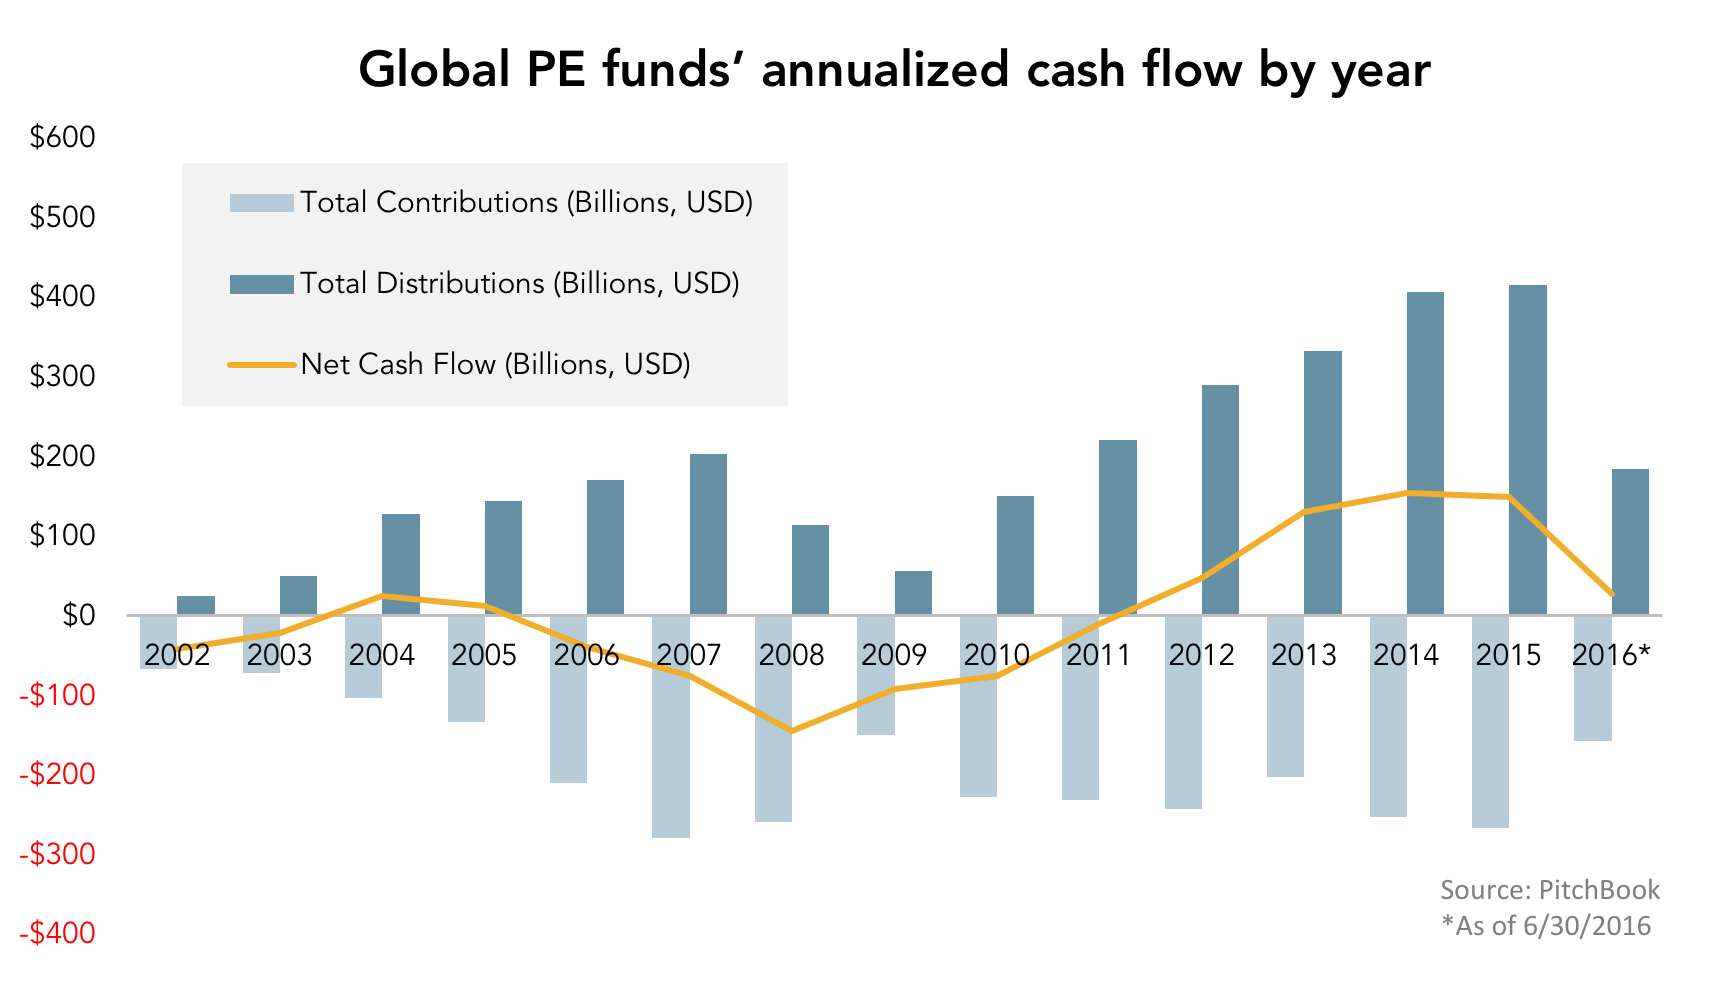
Since 2012, net cash flows of private equity funds worldwide have been positive, with the last three full years handily exceeding $130 billion apiece. With fund returns through the middle of 2016, however, net cash flows currently stand at $27.0 billion, putting the back half of 2016 under considerable stress to even leave the year at more than $100 billion. This diminishing metric is attributable to a variety of factors, including the slow winding down of the buyout cycle in addition to a sluggish exit market. Preliminary figures for the first quarter of 2017 indicate a significant downturn in PE-backed exit volume in the US, even after a somewhat diminished 2016. Regardless of whether those preliminary figures hold, it would take a more-than-robust exit market to enable such heightened cash flows as would be necessary to match the tally of the prior three years. Of course, such heavily positive cash flows aren’t critical for the industry to achieve; the disparity is more driven by significant sums still being invested given current market conditions more than a plunge in money returned to limited partners. Distributions have been strong, enabling significant fundraising success in terms of fund managers hitting their targets and suggesting general content among LPs. Accordingly, 2016 and even 2017 may well see a moderate decline in positive net cash flow, without such an occurrence boding poorly for the health of the PE industry. The longer such diminishing prolongs, however, if driven by continued heavy investment flows contrary to declining distributions, the more complicated the fundraising picture becomes for fund sponsors in general, particularly first-time firms.





Latest news

Rate hike expectations ease as term SOFR curve flattens
The CME six-month Term SOFR rate reached a recent high of 3.979% on July 28 before retreating to 3.837% as…

3Q26: New loan assets rise to 44% of total lending, a 3-year high
New loan assets as a proportion of total US loan volume make up 44% of the 3Q26 pipeline to date,…

North American GPs dominant as fundraising accelerates
Our PEI Private Credit 200 ranking also shows capital raising increasing overall – and accelerating especially fast for the largest…