



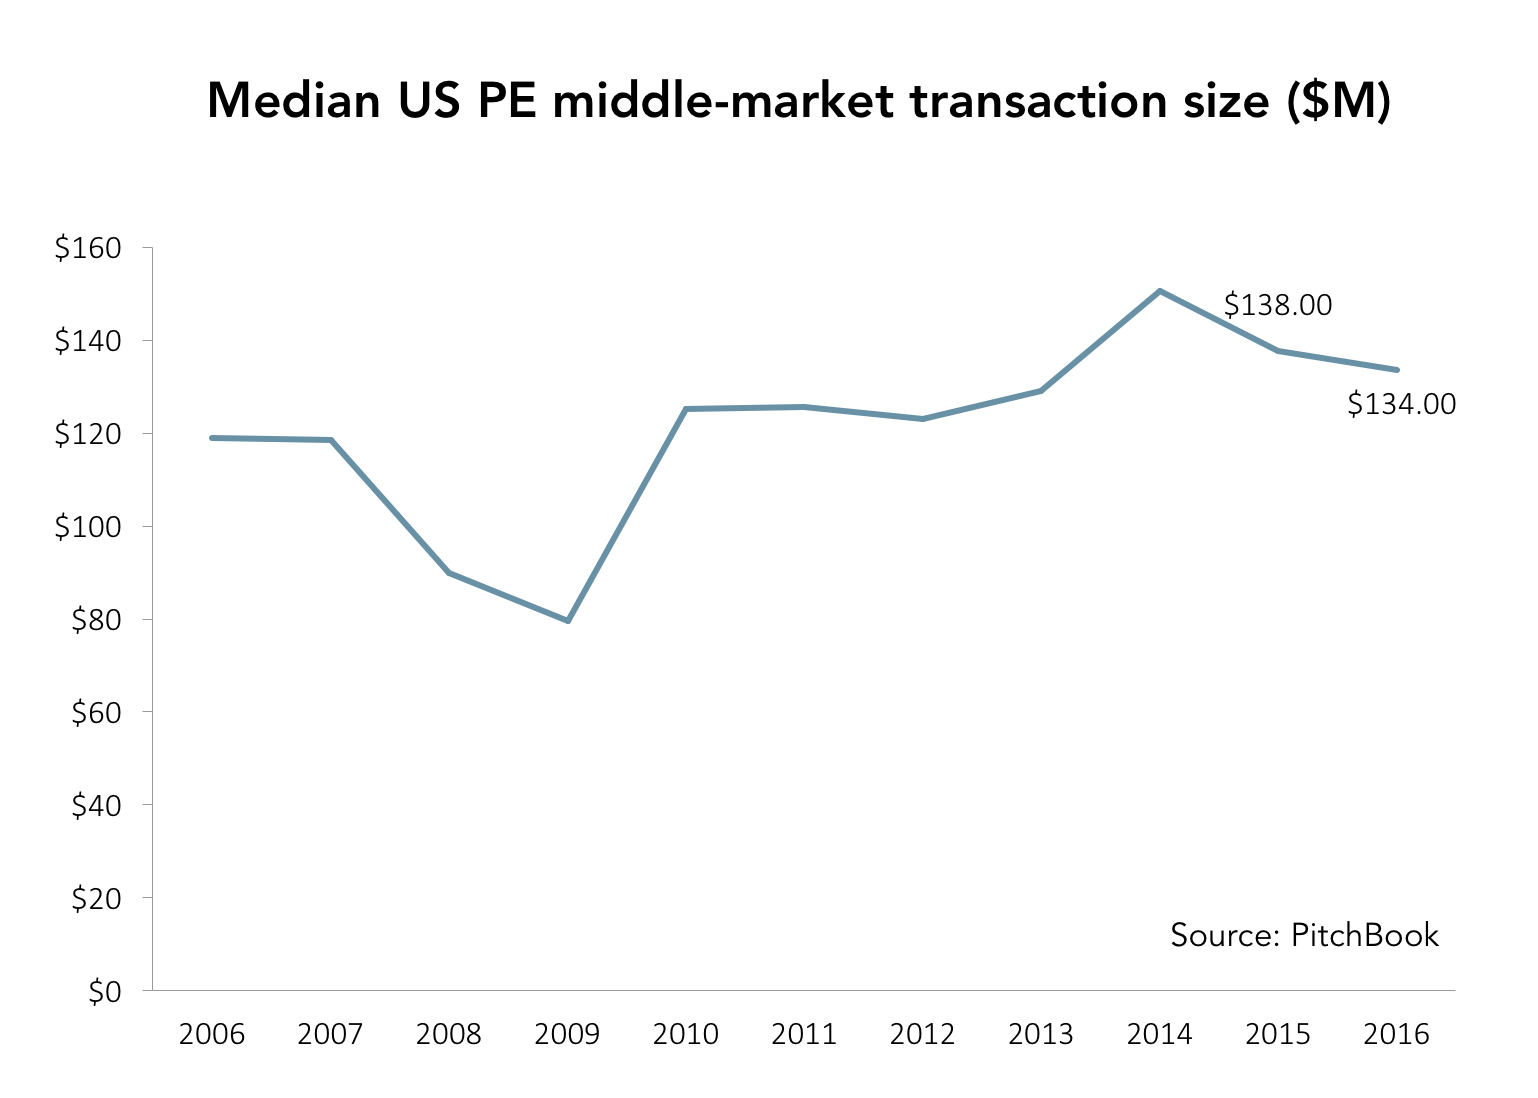
The median private equity transaction with a US middle-market company fell slightly to $134.0 million in 2016, down a mere $4 million from the prior year. Given the minuscule magnitude of the decline, it’s clear that there is still plenty of competition from not only strategic acquirers in the upper end of the market but also fellow PE firms that are keeping transaction sizes relatively high, among other factors. But the median transaction size also speaks to just how much activity is concentrated in the lower middle market and the smaller end of the core middle market. It’s simply where many of the best-value propositions lie nowadays. Moreover, newer PE funds tend to be smaller and as there was an influx of emerging managers over the past several years, their consequent scope would boost deal flow within the lower reaches of the US middle market. The role of relative sector popularity should not be underestimated as well—nowadays many of what are perceived to be safer investment opportunities are within fragmented sectors such as healthcare services. Last but not least, the prevalence of add-ons as a strategy also definitely plays into skewing the median deal size lower, as PE fund managers look to build out extant portfolios at more reasonable prices and save via typical integrative strategies.
View PitchBook’s 2016 Annual US PE Middle Market Report here.





Latest news

Rate hike expectations ease as term SOFR curve flattens
The CME six-month Term SOFR rate reached a recent high of 3.979% on July 28 before retreating to 3.837% as…

3Q26: New loan assets rise to 44% of total lending, a 3-year high
New loan assets as a proportion of total US loan volume make up 44% of the 3Q26 pipeline to date,…

North American GPs dominant as fundraising accelerates
Our PEI Private Credit 200 ranking also shows capital raising increasing overall – and accelerating especially fast for the largest…