



Will elevated US PE inventory contribute to continued secondary buyout activity?
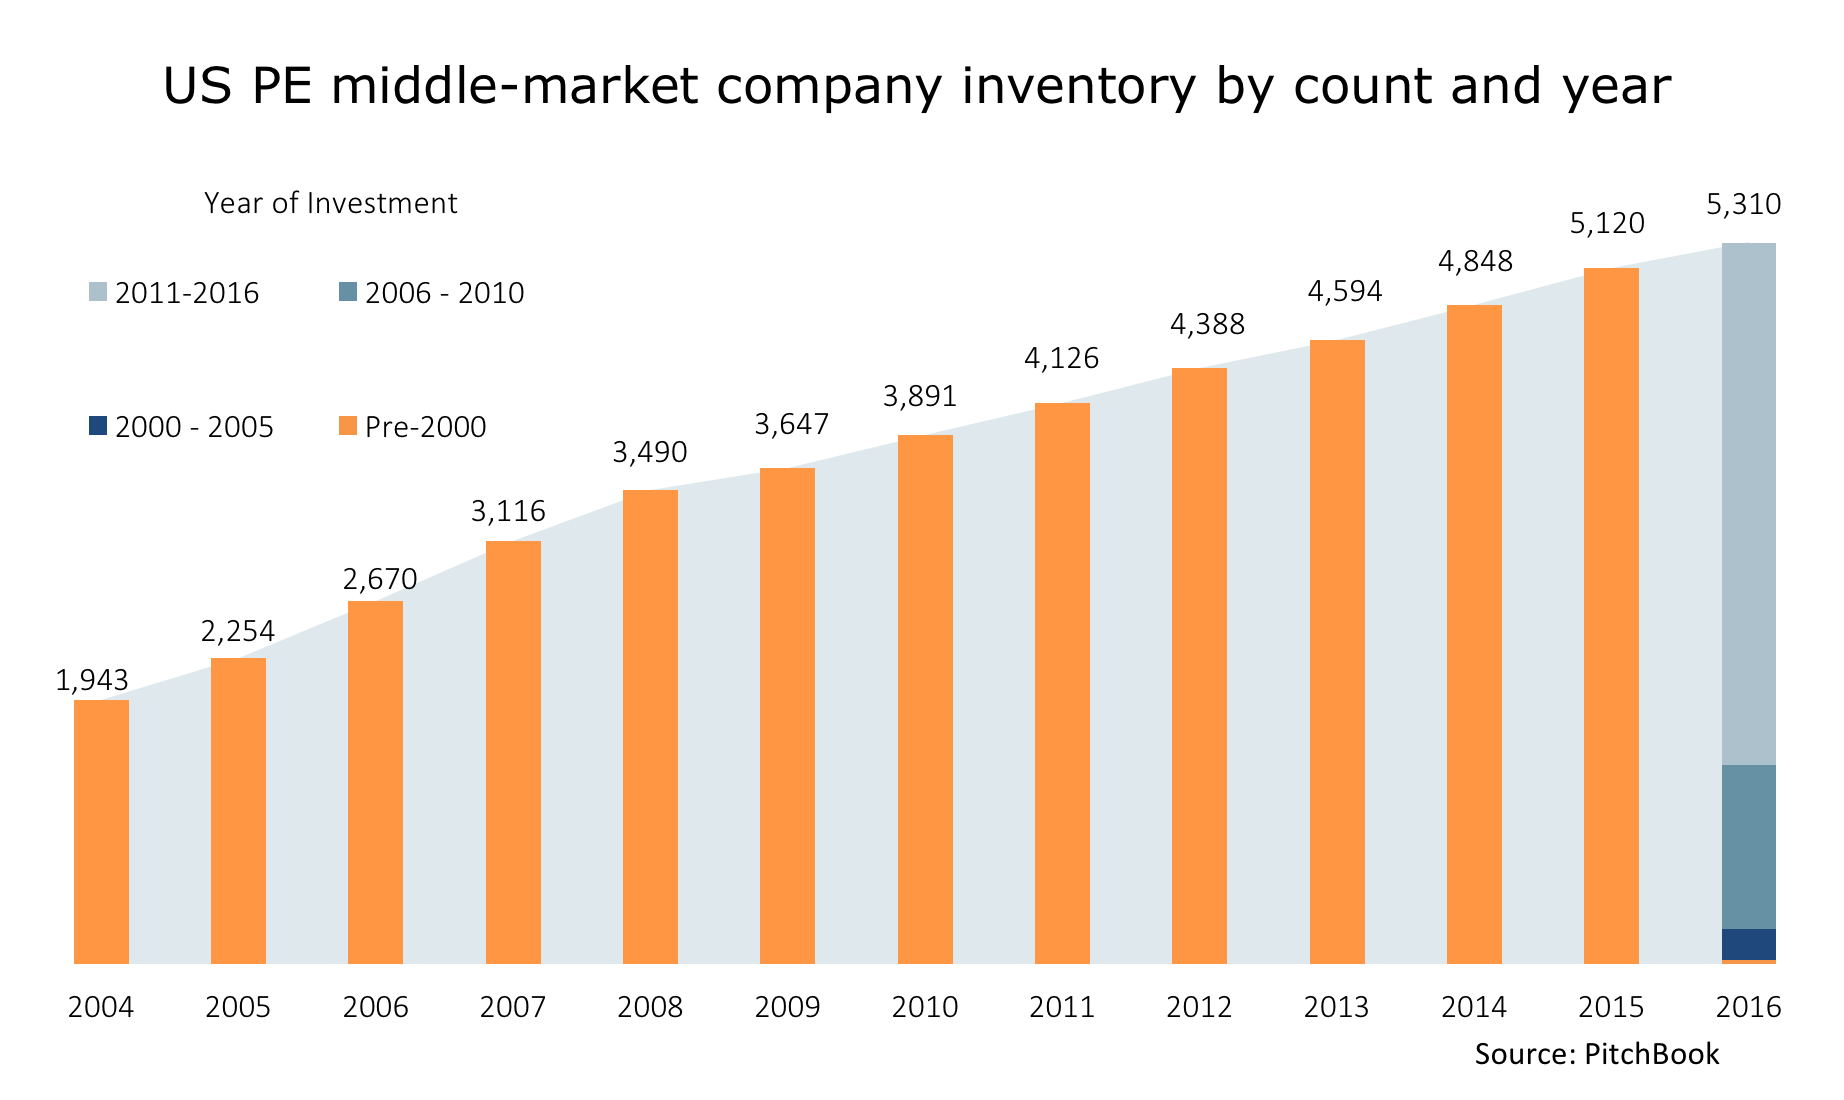
It is difficult to get a sense of just how many middle-market companies there are in the US, which is a critical statistic to have on hand when analyzing the impact of the heightened private equity inventory. According to a recent installment of the Middle Market Power Index from American Express and Dun & Bradstreet, there were 182,578 firms that had between $10 million and $999 million in revenue in 2016. Now, PitchBook defines the middle market quite differently, utilizing transaction size ranges to determine if a PE deal fell between $25 million and $1 billion in size (equivalent to enterprise value). Hence, much of the upper echelons of the Middle Market Power Index population would not be within the typical PE investment firm’s purview. Assuming a distribution that is not normal, but rather heavily weighted toward the smaller end of the revenue range, and a typical revenue multiple range of 1x-5x, we can roughly estimate that only businesses between $25 million and $200 million in revenue would really fall within the PitchBook middle-market scope—say, 35% to 40%. That’d put the total number of middle-market enterprises more relevant to our analysis at close to 64,000 at the lower bound. As PitchBook posits the number of US middle-market companies that have PE backing at 5,310, that’d put PE penetration of the middle market in particular at 8.3%. Again, this is very much a ball-park figure.
Looking at that number, it’d seem like there remains a significant supply of US middle-market companies to pursue. So will secondary buyout activity continue at a heightened clip, given the prospective population of targets?
Granted, much of that supply is concentrated in the lower middle market, given the assumed distribution of companies along size ranges. However, given the increased prevalence of secondary buyout activity over the past several years, it’s clear that PE sourcing strategies have expanded to include PE portfolio companies more than was customary in the past. And on an anecdotal basis, fresh buyout targets remain difficult to find. Both those trends could seem at odds with the 8.3% figure, but only a modest portion of middle-market companies are well-positioned for PE involvement in the first place—multiple factors have to align before a company usually centers in PE investors’ crosshairs, ranging from debt-carrying ability, management plans, business model and more. Moreover, given the current level of transaction multiples overall, investors are remaining somewhat shyer than in the headier days of 2014 and 2015. One of the realms where one is likelier to find a target that presents a worthwhile opportunity for PE backing is, of course, a fellow PE firm’s portfolio. That is predicated on a firm having a specialist strategy wherein they can create further value beyond typical general operational tweaks, but does help explain increased secondary buyout activity. Furthermore, many PE funds are looking for businesses that are larger than those found in the lower middle market, so they will be hunting in the core to upper reaches of the middle market, where larger buyout shops have been active for some time. Last but not least, larger PE funds often purchase smaller, PE-backed firms in order to expand them in terms of size or geographic scope. Accordingly, it seems likely that elevated secondary buyout activity is set to continue, due not only to those motivations but also the continued expensive environment, in what would seem a contrary trend given the level of US PE backing relative to the entire US middle market. That could shift in the case of any significant economic downturn inducing distress among small-to-medium enterprises, which would render a larger fraction of the middle-market population more appealing to PE investing approaches. Whether or not that transpires in 2017, especially given the odd levels of optimism around unrealized changes in government policies, remains to be seen.
View PitchBook’s 2016 Annual US PE Middle Market Report here.





Latest news

Rate hike expectations ease as term SOFR curve flattens
The CME six-month Term SOFR rate reached a recent high of 3.979% on July 28 before retreating to 3.837% as…

3Q26: New loan assets rise to 44% of total lending, a 3-year high
New loan assets as a proportion of total US loan volume make up 44% of the 3Q26 pipeline to date,…

North American GPs dominant as fundraising accelerates
Our PEI Private Credit 200 ranking also shows capital raising increasing overall – and accelerating especially fast for the largest…