



Has US add-on activity peaked?
Last year, US private equity investors added on to extant holdings so frequently that the proportion of add-ons to all buyouts hit no less than 64%. The steady increase over the past six years, and especially the rapid surge of 3% even as overall activity fell, both speak to the increasing maturation of adding on as a PE investment strategy and its relative attraction in the current environment. As has been clearly established, add-ons simply make more sense nowadays given high prices, strategic competition and increased caution. But given their prevalence, as well as the normalizing level of PE activity in the US, have they reached a peak proportion of US buyout activity?
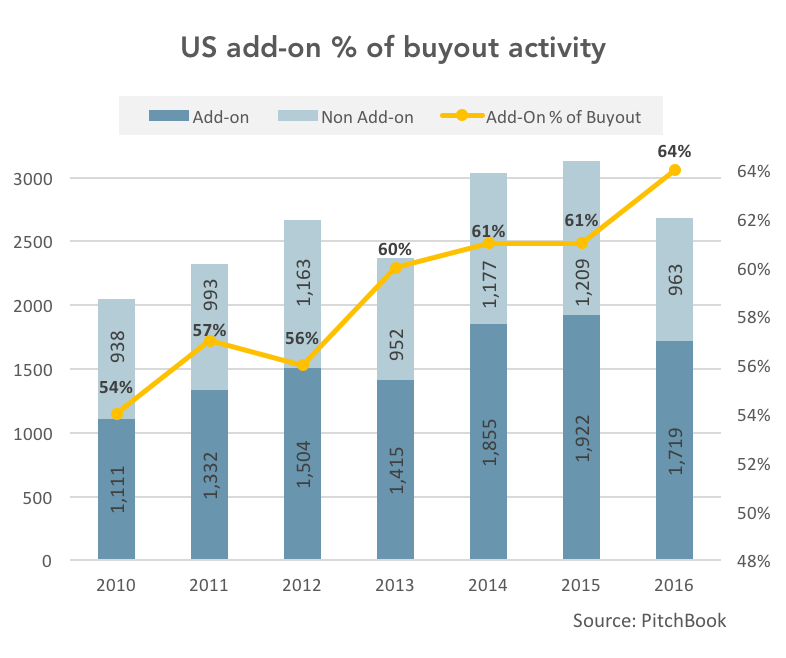
Continued declines in buyout volume owing to sustained strategic competition and high prices could contribute to add-ons staying at an elevated percentage, but what would really drive their proportions even higher or contribute to a downtick, in our estimation, are sector-specific factors. Between 2015 and 2016, the absolute count of add-ons in most sectors declined substantially, in tandem with overall buyout activity. But healthcare and IT add-ons stayed resilient or even increased slightly in frequency, testifying to sector-specific trends rendering platform building relatively more attractive. Should buyouts slide further in volume, all other current factors holding constant, and tech and healthcare retain their attraction, it is likely add-on proportions could rise even further. That being said, as buyout activity is unlikely to decline at a similar rate but rather normalize in 2017 at the subdued levels observed as of late, it’s most probable that add-on proportions have peaked and will only plateau going forward.





Latest news

Rate hike expectations ease as term SOFR curve flattens
The CME six-month Term SOFR rate reached a recent high of 3.979% on July 28 before retreating to 3.837% as…

3Q26: New loan assets rise to 44% of total lending, a 3-year high
New loan assets as a proportion of total US loan volume make up 44% of the 3Q26 pipeline to date,…

North American GPs dominant as fundraising accelerates
Our PEI Private Credit 200 ranking also shows capital raising increasing overall – and accelerating especially fast for the largest…