



We dig deeper into Private Debt Investor fundraising data from the first half of this year.
In this column last week, we provided readers with the headline fundraising numbers from the first half of this year – which indicated that 2026 could be a record-breaker if institutional support continues at present levels.
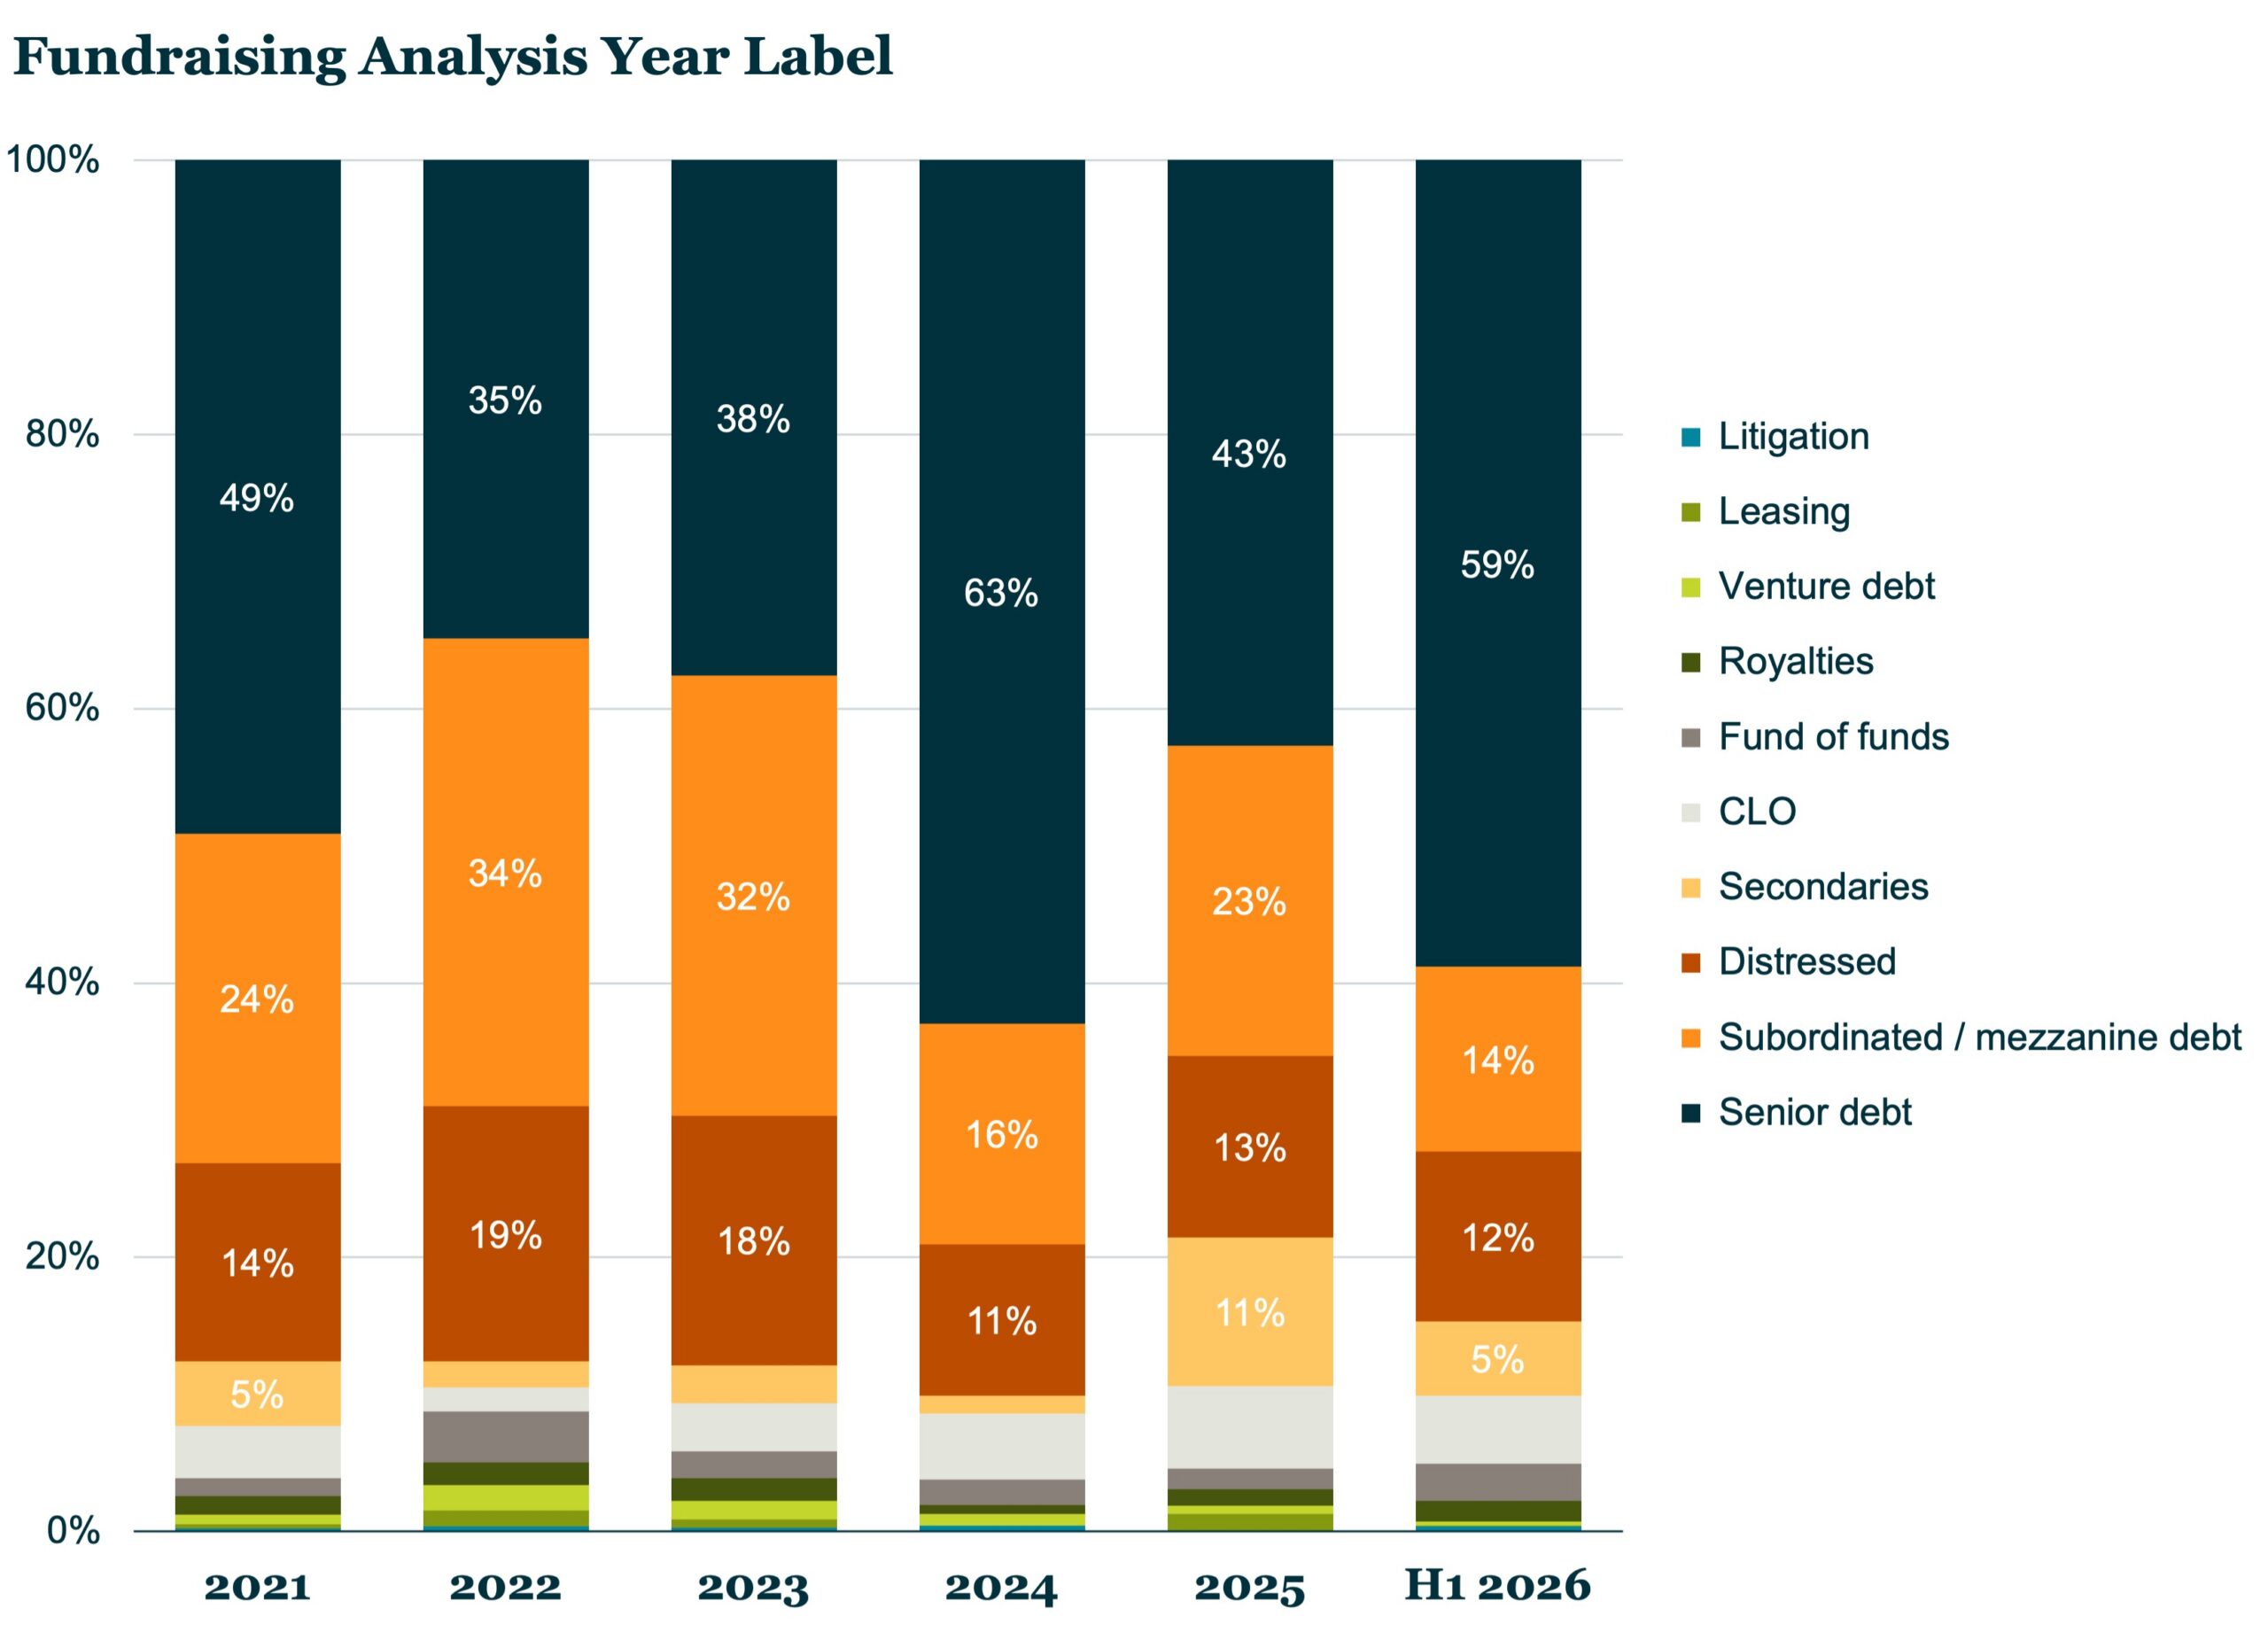
But beyond the headline numbers, what else are we observing about the current nature of private credit fundraising? One is that funds focused on providing senior debt are once again soaring in popularity (see chart). In 2024, such funds soared to 63 percent of total fundraising but last year fell to their more typical annual share of around 40 percent. In H1 2026, they were back up to 59 percent.
Other strategies tipped to flourish have struggled to match senior debt’s fundraising success. Subordinated and mezzanine debt slipped from 23 percent of the total in full-year 2025 to 14 percent in H1 2026 while credit secondaries – which reached an all-time peak of 11 percent last year – dropped back to 5 percent. Distressed fundraising has stabilised, edging down just one percent from 13 percent to 12 percent.
When it comes to regional appetite, strong backing for North America-focused funds provides an interesting contrast with the retail investor withdrawal from semi-liquid funds – suggesting that, while retail investors have run scared from negative headlines, the likes of pension funds and insurance companies have not followed suit.
North America’s share of the capital stood at a hefty $116 billion in H1, far ahead of the $45 billion raised by funds with a focus on Europe and $43 billion by those focused on multiple regions. This meant that North America accounted for 56 percent of all capital raised in the first half, versus a combined 41 percent for Europe and multi-regional.
Such is the institutional appetite for private credit at the current time that 52 percent of funds closed in H1 exceeded their target – compared with an average of 41 percent for the preceding five years. Only 22 percent fell below target – compared with a five-year average of 42 percent.





Latest news

Multiples on PE buyouts
This quarter marks our integration of SPI by StepStone as the primary source for US buyout valuation metrics for the PE Breakdown.

US Leveraged Loan Issuance Slows to $76.5b in July
The US leveraged loan market has continued to slow from the May level of $104.7b, with approximately $76.5b priced in…
