



- Request access to the full analysis here.
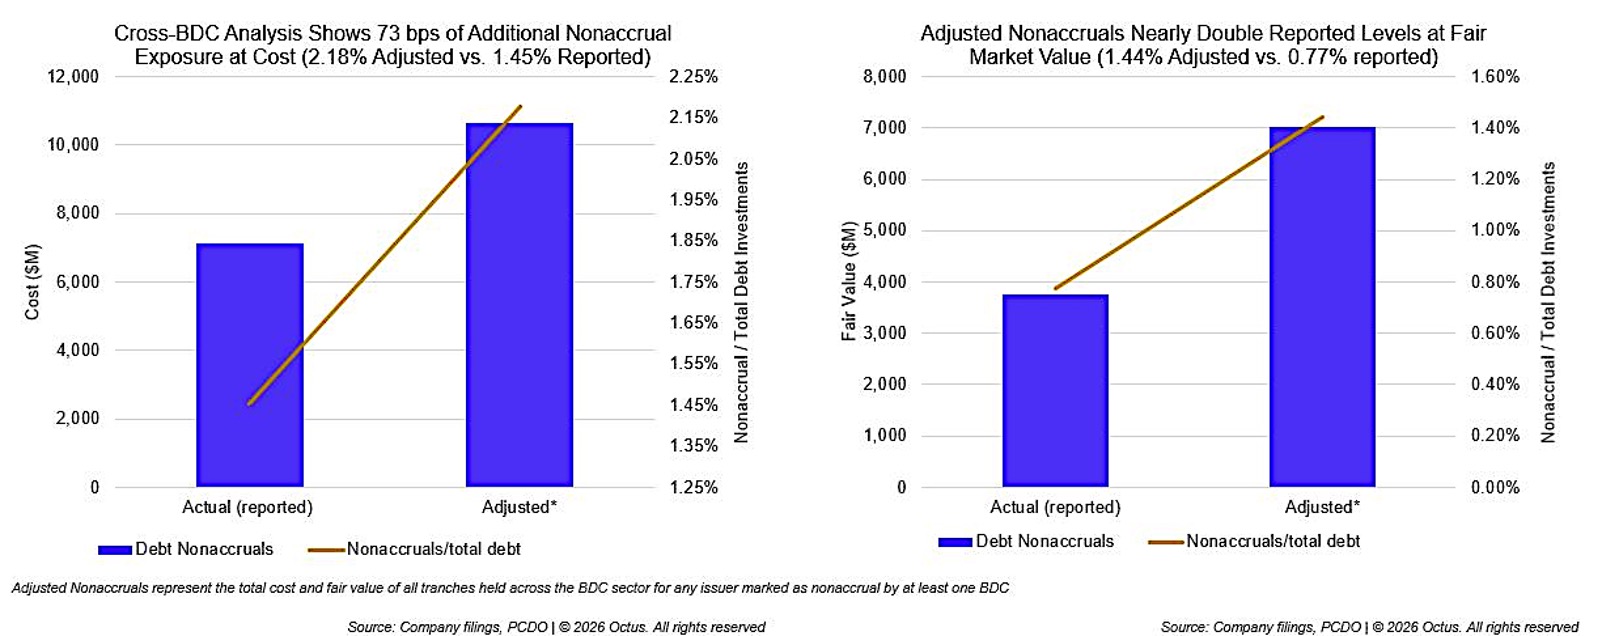
Octus performed a cross-BDC analysis to identify the total cost and fair value of all tranches held across the BDC sector for any issuer marked as nonaccrual by at least one peer. This methodology provides an adjusted nonaccrual rate that captures the full sectorwide exposure to any nonaccrual name. Our analysis shows that total exposure at cost would have been $10.66 billion, representing a 50% increase over reported values; this translates to 73 bps of additional exposure (2.18% adjusted versus 1.45% reported). The discrepancy is even more pronounced at fair value, where total nonaccrual holdings of $7.02 billion are 86% higher than reported figures. At fair value, adjusted nonaccruals nearly double reported levels (1.44% versus 0.77%).



Latest news

US Leveraged Loans Return 3.36% to Investors YTD
The Bloomberg US Leveraged Loan Index (Ticker: LOAN) returned 0.96% in August and has gained an additional 0.28% through September…

PE dry powder
The capital that is being raised is flowing overwhelmingly to the largest, most established managers.

Middle market debt held by BDCs vs High yield vs Treasury yields
The blue line represents the current dividend yield of the VanEck BDC Income ETF (BIZD), which stood at 11.7% as…