



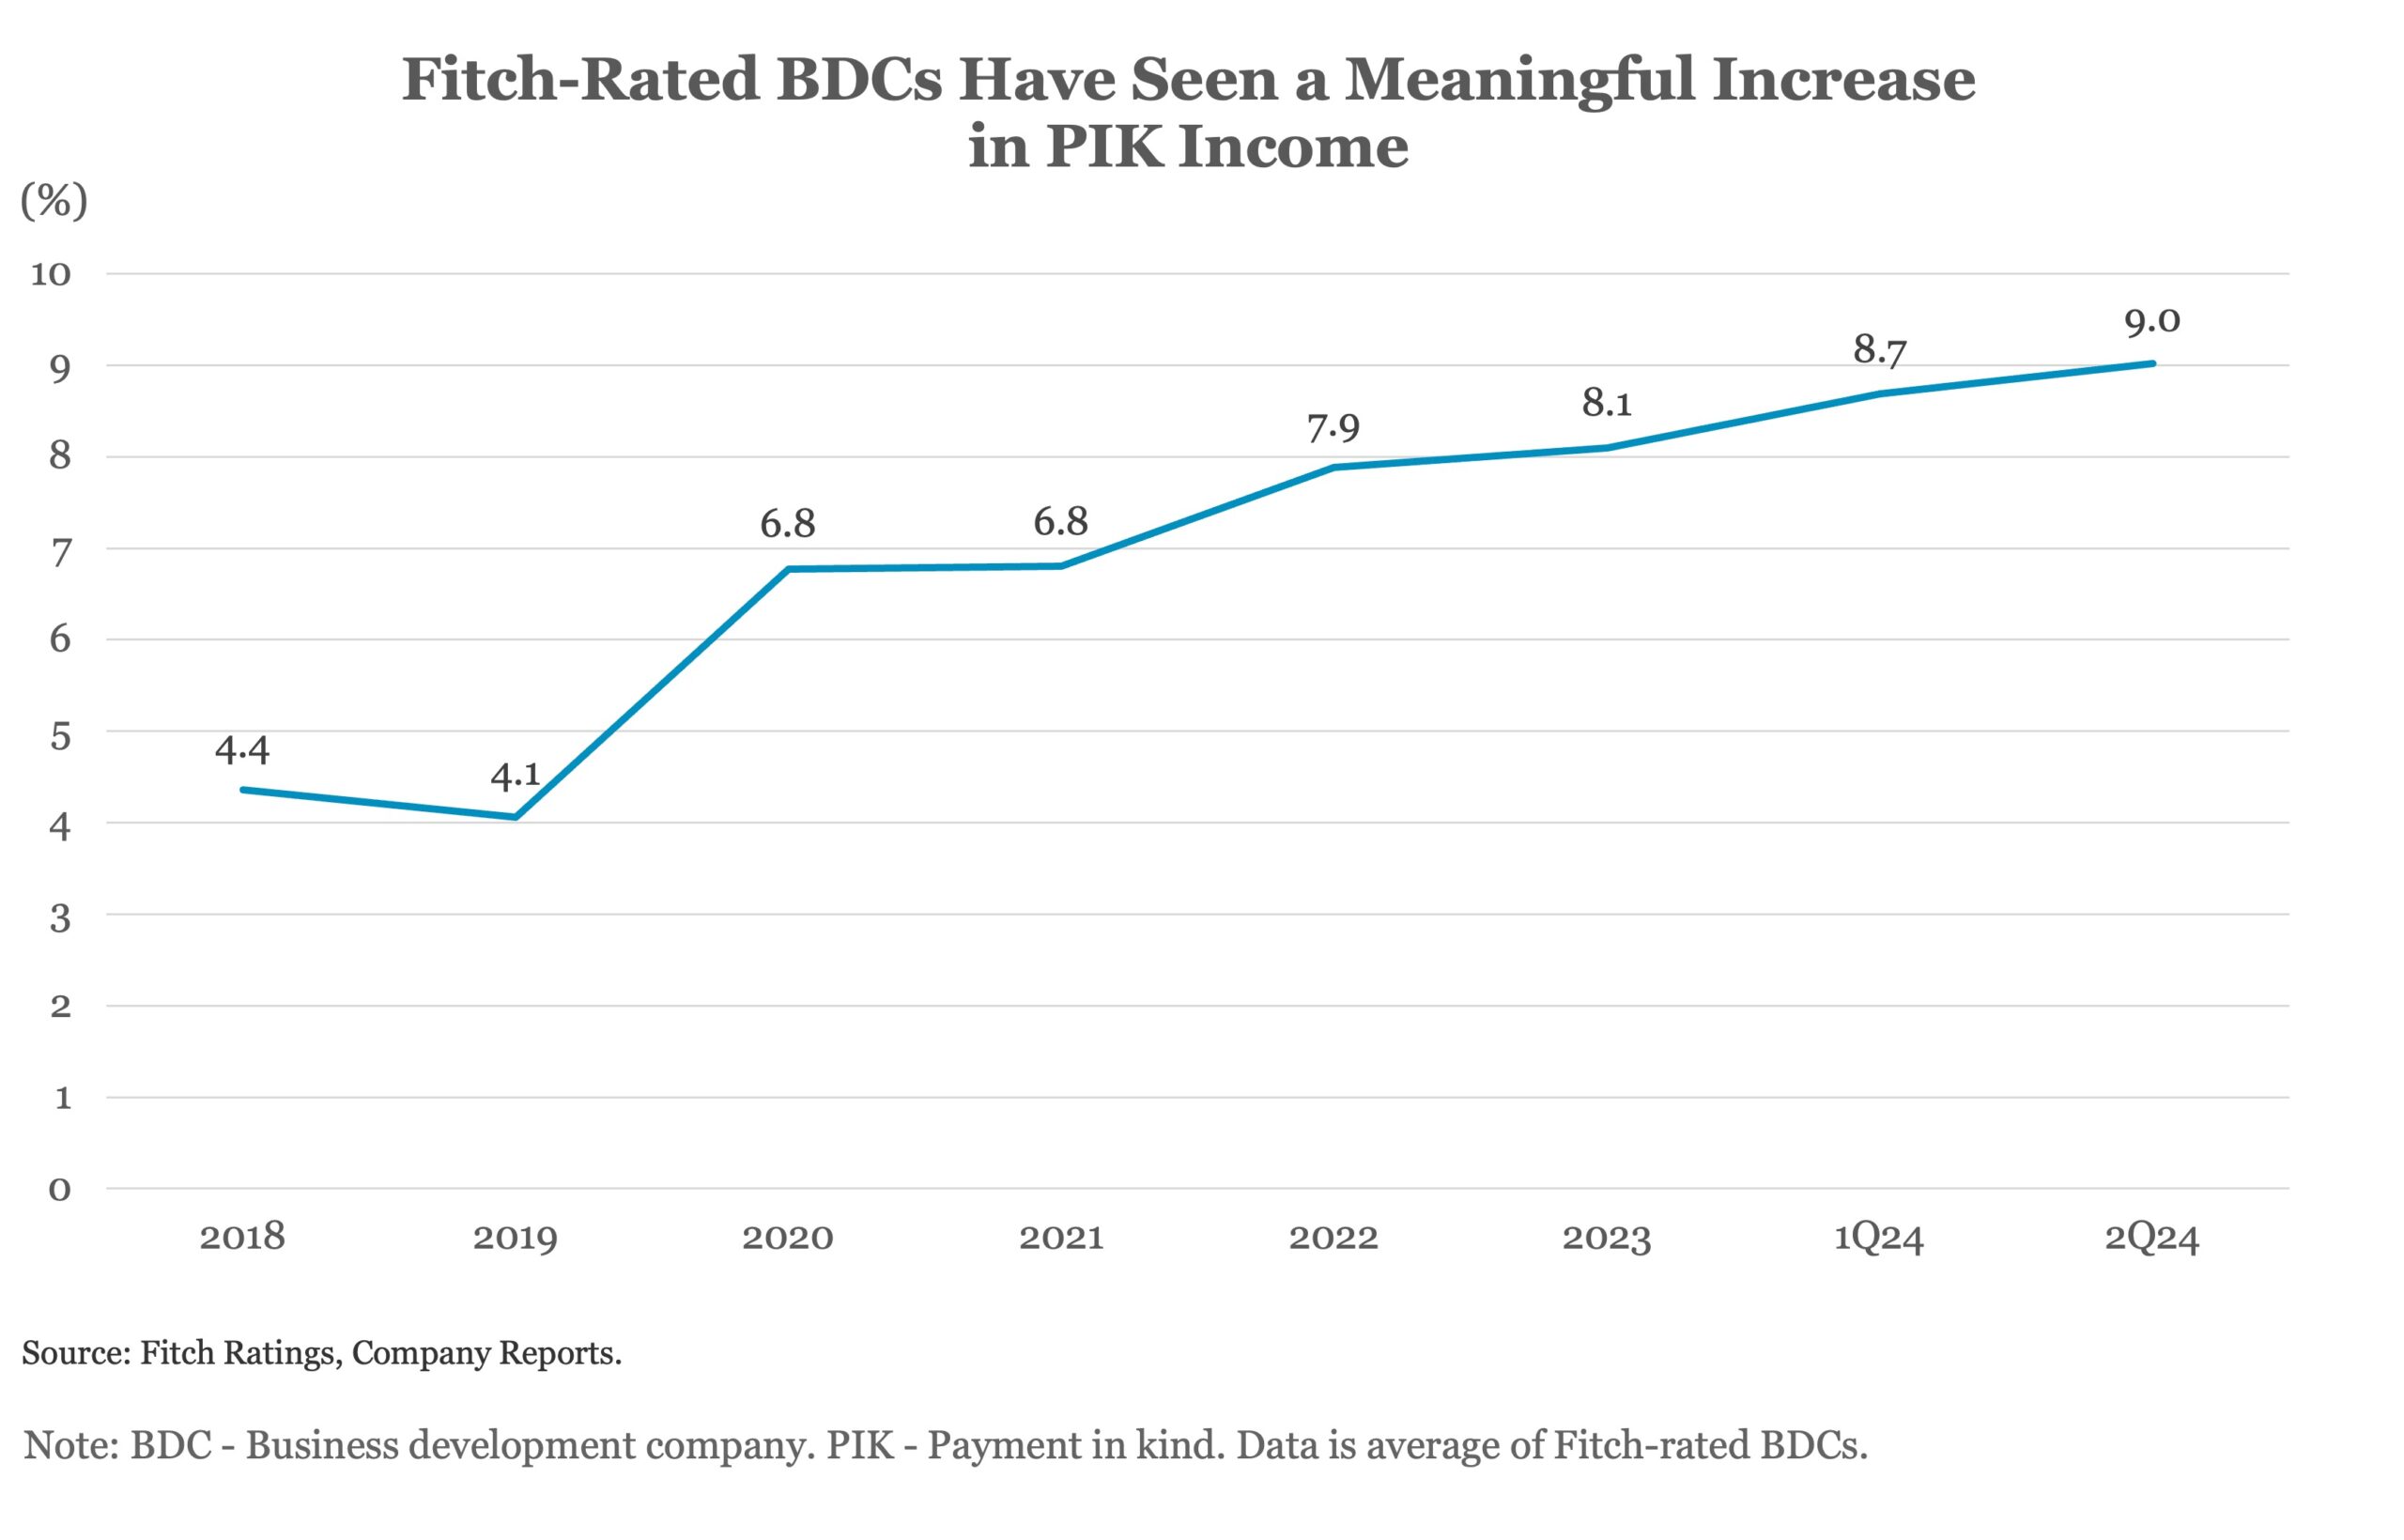
BDC Cash Income Dividend Coverage Pressured by Payment-in-Kind Income
Click here to learn more.
U.S. business development companies’ (BDCs) cash earnings coverage of dividends is expected to weaken further from 2Q24 levels as the persistence of elevated interest rates will drive further increases in paid-in-kind (PIK) income, Fitch Ratings says. Potential rate cuts, spread compression and higher non-accruals are also headwinds to BDCs’ net-investment income (NII).
While the introduction of supplemental dividend frameworks by many BDCs in recent years should preserve dividend coverage on a gross NII basis, coverage has already fallen below 100% on a cash earnings basis and is expected to remain under pressure.
In 2Q24, 18 Fitch-rated BDCs exhibited cash earnings dividend coverage (NII adjusted for net non-cash interest income/regular declared dividends) below 100% despite strong growth in NII from high rates. Sustained cash earnings coverage below 100% is viewed negatively. For 2Q24, PIK averaged 9.0% of interest and dividend income for the rated peer group, up from 8.7% in 1Q24 and 8.4% in 2Q23. BDCs are required to distribute 90% of taxable income, including PIK interest, and increasing PIK interest income could result in mismatches between cash interest received and cash dividends paid out.





Latest news

Rate hike expectations ease as term SOFR curve flattens
The CME six-month Term SOFR rate reached a recent high of 3.979% on July 28 before retreating to 3.837% as…

3Q26: New loan assets rise to 44% of total lending, a 3-year high
New loan assets as a proportion of total US loan volume make up 44% of the 3Q26 pipeline to date,…

North American GPs dominant as fundraising accelerates
Our PEI Private Credit 200 ranking also shows capital raising increasing overall – and accelerating especially fast for the largest…