



Click here to learn more.
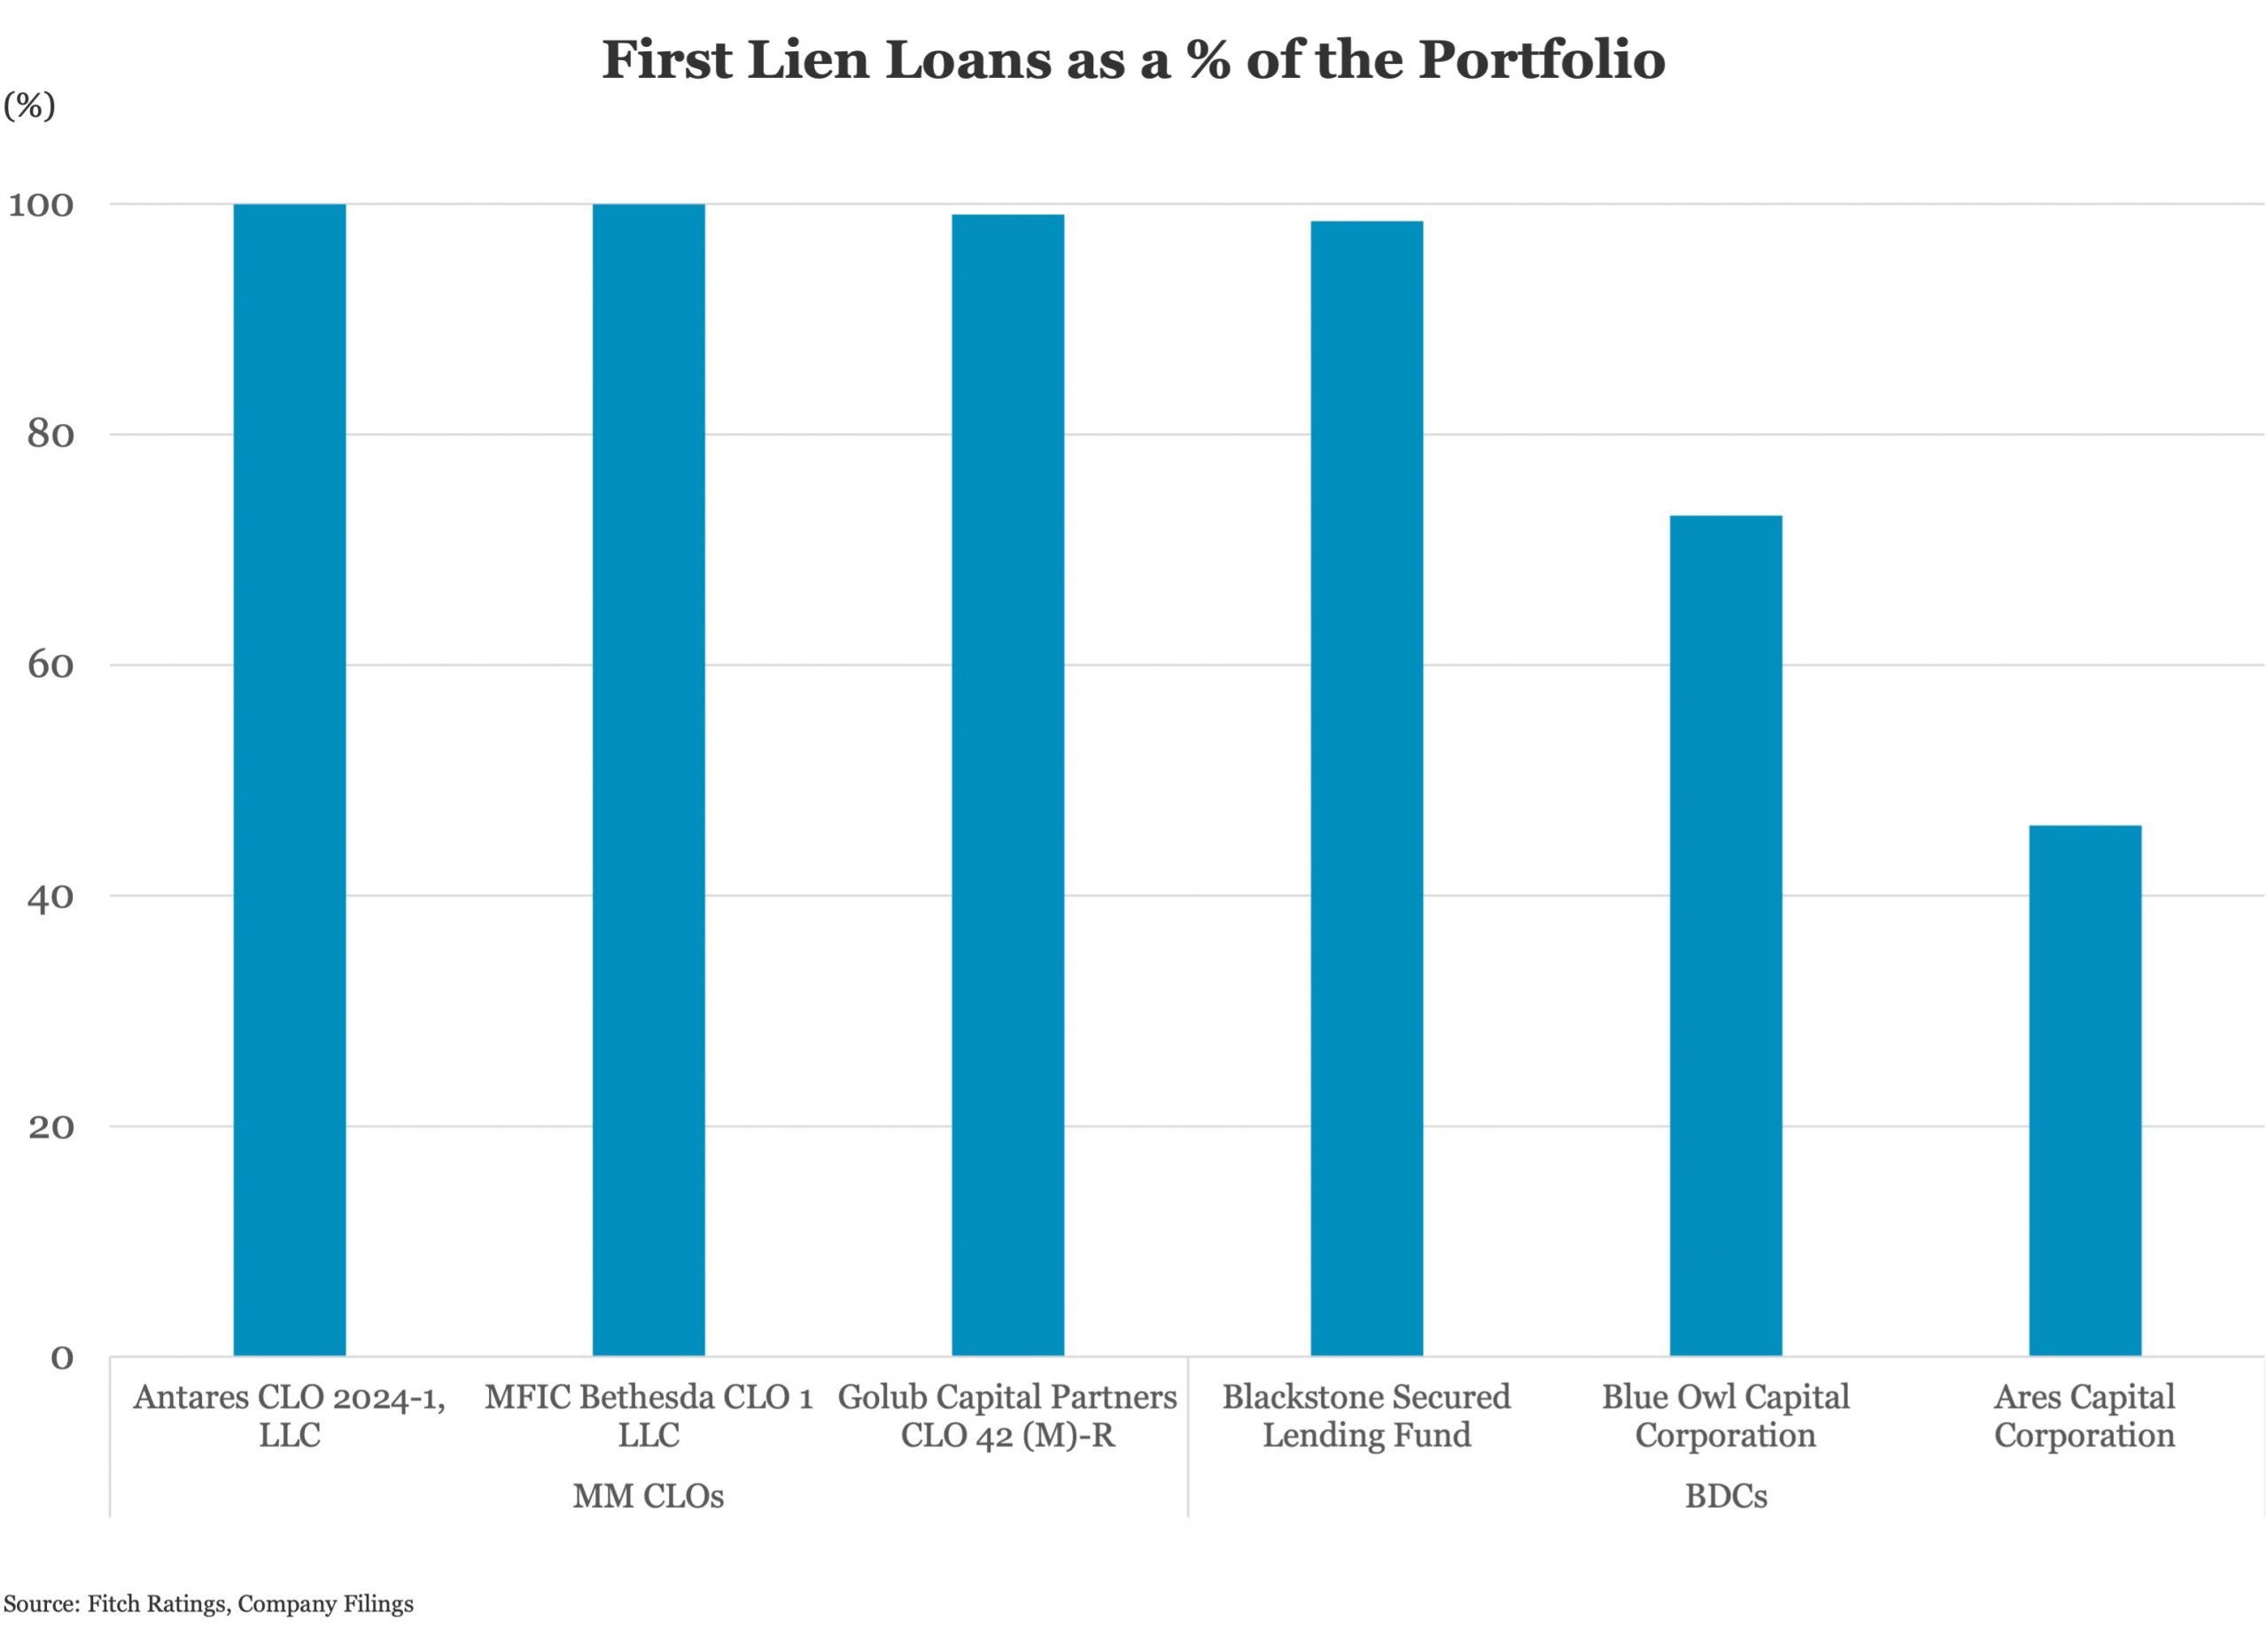
There can be a meaningful difference in the seniority of the assets in a MM CLO versus those in a BDC. MM CLOs consist almost exclusively of first lien senior secured loans, while BDCs can invest all the way down the capital structure. At March 31, 2024, first lien loans represented 77.8% of rated BDC portfolios, on average, with the remainder invested in second lien loans, subordinated debt, preferred equity, common equity, and structured finance investments. First lien exposures at BDCs ranged from 46.1% of the portfolio, at fair value (Ares Capital Corporation; ‘BBB’/Positive), to 98.5% (Blackstone Secured Lending Fund; ‘BBB’/Stable) at March 31, 2024. All else equal, first lien loans are more ‘leverageable’ than junior debt and equity securities given their contractual cash flow yield and stronger recovery prospects in the event of default.





Latest news

Rate hike expectations ease as term SOFR curve flattens
The CME six-month Term SOFR rate reached a recent high of 3.979% on July 28 before retreating to 3.837% as…

3Q26: New loan assets rise to 44% of total lending, a 3-year high
New loan assets as a proportion of total US loan volume make up 44% of the 3Q26 pipeline to date,…

North American GPs dominant as fundraising accelerates
Our PEI Private Credit 200 ranking also shows capital raising increasing overall – and accelerating especially fast for the largest…