


Markit Recap – 10/26/2015

In bond markets, liquidity can be described as the ability to transact with size, at low cost and with minimal price impact. The topic has been of much conversation over the past few years as market participants fret over the potential systemic risks that can arise from illiquid bond markets.
While overall consensus is that bond market liquidity has been deteriorating, certain bond markets remain healthier than others. To test this, the constituents of Markit’s iBoxx indices can be used to provide a gauge of the investment grade corporate bond universe in three regions: Europe, the US and the UK (for consistency, only domestic bonds were used).
The % of investment grade bonds with the highest liquidity score
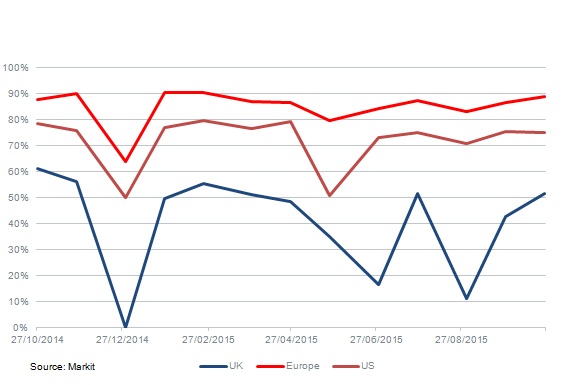
Unsurprisingly, the sample size was the smallest in the UK, matching its relative size in comparison to corporate bond markets in Europe and the US. While quantitating liquidity remains ambiguous, Markit’s liquidity metrics are derived from its bond pricing service and provides an indicative view for judging these three markets.
One method of viewing liquidity is by the number of dealers quoting a bond. The dealer count is defined as the number of unique dealers quoting a bond on a given day, which can be averaged across all the sample bonds in the region to provide a top down view.
The results show that the UK corporate bond market lags its European and US counterparts. In October, UK bonds saw an average of 4.54 dealers per bond, half of the 9.01 seen by European peers and less than the 5.85 seen in the US.
This trend was exasperated by this summer’s global market volatility, which saw average dealer counts fall across the board. August saw a low of 2.08 dealers per bond for UK issues, half the average level.
A broader measure of liquidity is Markit’s liquidity score, which takes into account bid/ask spreads, maturity, number of different sources and shadow liquidity. A score from 1-5 is determined, with 1 being the highest rank.
This metric also highlights the lack of liquidity in the UK bond market, as the percentage of bonds with the highest ranking (1) in the UK (52%) lags its global peers. 75% of US and 89% of European bonds within the iBoxx investment grade universe meet the highest liquidity criteria.
Perhaps most worryingly for UK bond traders are the fact that this liquidity dispersion has been growing over the year. The UK saw its share of bonds ranked with the highest liquidity score drop to 11% in August and has averaged only 41% this year. Elsewhere, Europe has maintained 80%+ of bonds ranked with a liquidity score of 1 this year, while the US has maintained 70% bar a blip in May, even amid this summer’s market volatility.
A year on year comparison also highlights the deteriorating conditions in the UK bond market. The percentage of bonds with a liquidity score of 1 was 9% greater last October, with more bonds in the liquidity score 2 and 3 categories this October. Over the year, of the 190 bonds in the UK market sample, only 12 saw an improvement in liquidity score while 40 saw a downgrade.
Contact: Gavan Nolan
Email: Gavan.Nolan@markit.com





Latest news

U.S. LevFin markets steady in 2Q26; credit quality divide widens
North American leveraged finance markets remained active in 2Q26, but performance gaps across credit tiers widened, according to a new Fitch Ratings report.

Lack of new issues clouds CLO market
It’s been boom time in the leveraged loan market but now that market has eased off, what are the implications…

Multiples on PE buyouts
This quarter marks our integration of SPI by StepStone as the primary source for US buyout valuation metrics for the PE Breakdown.