



The percentage of LBO deals with leverage levels greater than six times has returned to 2007 levels. So far in 2014, LPC tracked 46 LBO deals (where deal details were available) or 57% of the total with total leverage greater than the regulators’ benchmark 6 times debt to EBITDA which mirrors 2007 levels. However deals are much smaller today than they were pre-crisis as the average purchase price for large corporate LBO deals is $1.9 billion in 2014 compared to $5.1 billion in 2007. 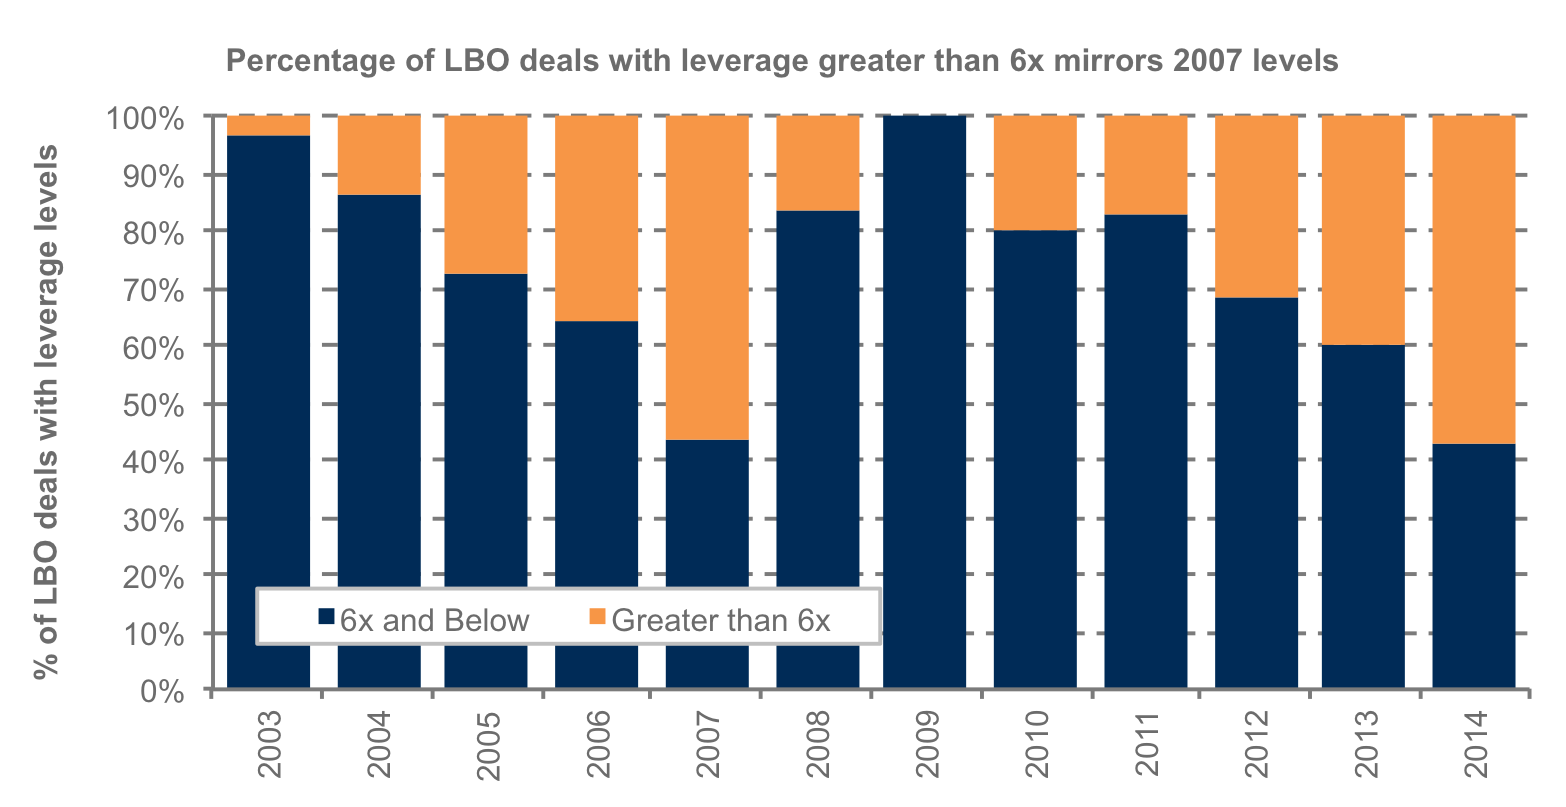 Despite Leverage Lending Guidance, debt to EBITDA for LBO deals has been steadily climbing due to lofty purchase price multiples coupled with an abundance of liquidity in the market place. Based on both large corporate and institutional middle market deals tracked by LPC, the average total debt to EBITDA has climbed to 6.1 times this year, up from 5.85 times in 2013 and 5.5 times in 2012. However, this figure is still more conservative than 2007’s 6.5 times. Still, several very aggressive deals have hit market this quarter. Based on data from Moody’s Investor Service, the following deals all had adjusted leverage of 7.0 times and greater this quarter: York Risk Services, Internet Brands, Acosta, National Vet, Advantage Sales & Marketing and iParadigm. Underliers
How is Leveraged Lending Guidance changing lending dynamics? Register now for LPC’s 20th Annual Loan Conference on Sept. 18th New registrations use PROMO “LEADLEFT2014”.





Latest news

Multiples on PE buyouts
This quarter marks our integration of SPI by StepStone as the primary source for US buyout valuation metrics for the PE Breakdown.

US Leveraged Loan Issuance Slows to $76.5b in July
The US leveraged loan market has continued to slow from the May level of $104.7b, with approximately $76.5b priced in…
