



There is no shortage of yield hungry investors in the middle market however second lien volume for smaller issuers has not kept pace with demand in 2015. Year to date, middle market second lien volume has only reached $1.6 billion, which is over 70% lower than the $5.6 billion logged in the first three quarters of 2014. The average tranche size is also down in 2015 in the $60-$75 million area compared to the $75-$125 million size range seen in 2014. 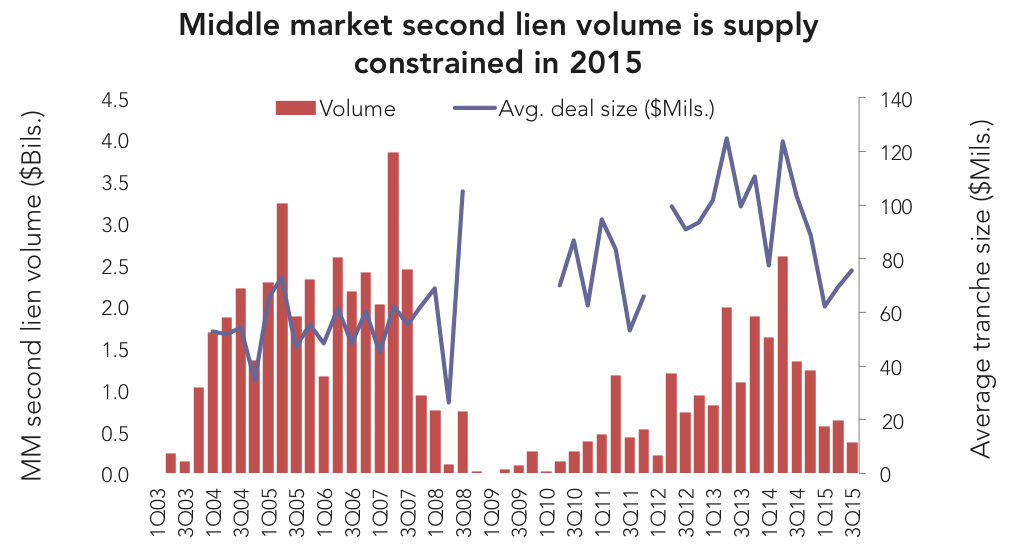
This leaves fewer investing opportunities for players requiring higher yields such as BDCs, mezz shops and credit opportunity funds. Downward price flexes were seen this quarter on Cast and Crew (tightened discount to 99.25) and CHI Overhead (tightened pricing to LIB+775 from LIB+800-825). As a result middle market second lien yields are grinding down, averaging around 9.82% in 3Q15, down from 10.1% in 2Q15 and 10.4% in 1Q15.

- Will rising rates create more demand for middle market assets given tighter structures and pricing premiums?
- When can we expect to see the M&A floodgates open for smaller issuers?
- Money continues to flow into the middle market but how are lenders finding ways to put it to work?
Contact: Fran Beyers
frances.beyers@thomsonreuters.





Latest news

Rate hike expectations ease as term SOFR curve flattens
The CME six-month Term SOFR rate reached a recent high of 3.979% on July 28 before retreating to 3.837% as…

3Q26: New loan assets rise to 44% of total lending, a 3-year high
New loan assets as a proportion of total US loan volume make up 44% of the 3Q26 pipeline to date,…

North American GPs dominant as fundraising accelerates
Our PEI Private Credit 200 ranking also shows capital raising increasing overall – and accelerating especially fast for the largest…