



Supported by solid technicals and a steady – if uninspired – pipeline of deals, the US loan market got a substantial boost in 2Q16 to push over US$550 billion in loan volume through the market and logging nearly US$905 billion of total issuance during the first six months of the year. Coming off a slow start to the year which included the completion of a series of financing slogged in late 2015, 2Q16 lending was up over 55% compared to 1Q16 results on the back of improved market sentiment. 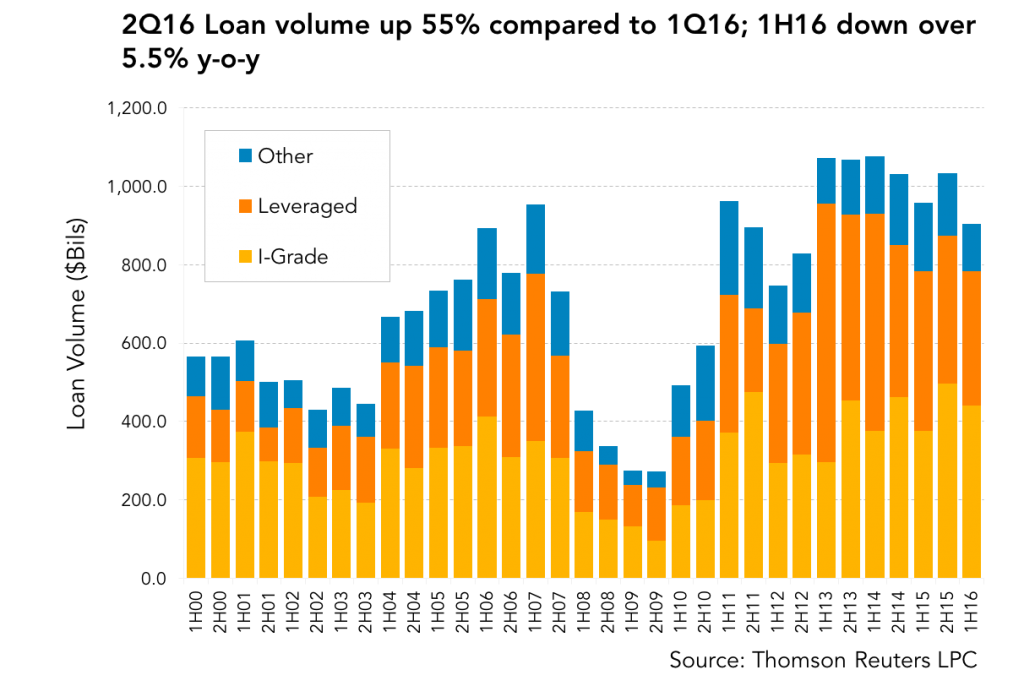 In turn, market sentiment seemed to be hinged on borrower efforts to time the market to take advantage of brief windows of opportunity to extend tenors or, occasionally, trim spreads. Both investment grade and leveraged lending was boosted – 67% and 64% respectively – quarter over quarter. Nevertheless, lenders say that some of this issuance represented a “false” supply of deal flow given limited new money lending opportunities. Less than 23% of 2Q16 investment grade loan volume represented new assets. For leveraged lenders, the news was arguably better with 47% of 2Q16 representing new money lending, but even this result was qualified given the series of opportunistic refinancings and an uptick in dividend recaps.
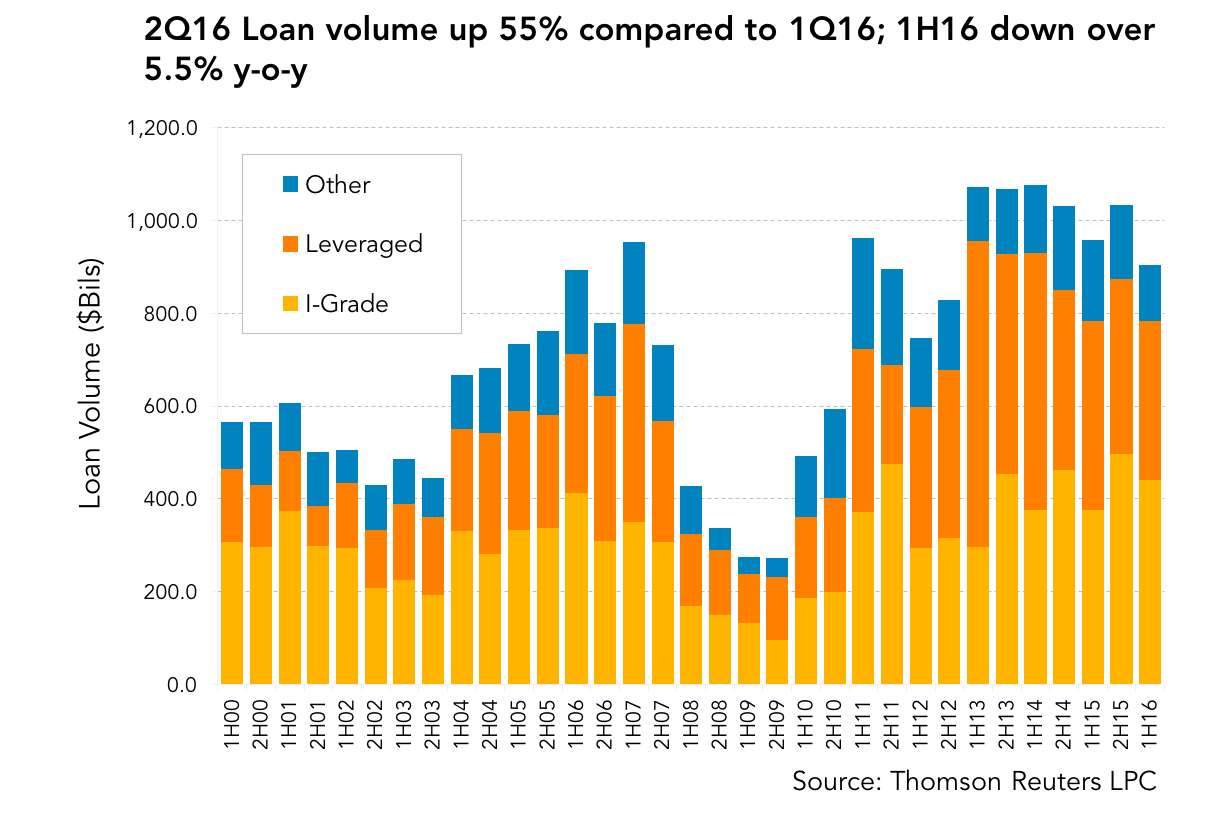 In turn, market sentiment seemed to be hinged on borrower efforts to time the market to take advantage of brief windows of opportunity to extend tenors or, occasionally, trim spreads. Both investment grade and leveraged lending was boosted – 67% and 64% respectively – quarter over quarter. Nevertheless, lenders say that some of this issuance represented a “false” supply of deal flow given limited new money lending opportunities. Less than 23% of 2Q16 investment grade loan volume represented new assets. For leveraged lenders, the news was arguably better with 47% of 2Q16 representing new money lending, but even this result was qualified given the series of opportunistic refinancings and an uptick in dividend recaps.
Contact: Maria Dikeos
Contact Maria Dikeos





Latest news


Software, consumer-related direct lending deals fell in H1'26
August 13, 2026
The software and technology sector, the second-most-active sector in 2025 at 17% of total deal activity, slid to fifth place in the first half of 2026.

Unconquered Territory
August 12, 2026
With most of the map still unexplored, there’s room for a sequel.