


Institutional loan repricings return in May, with issuers wielding most of the negotiating power

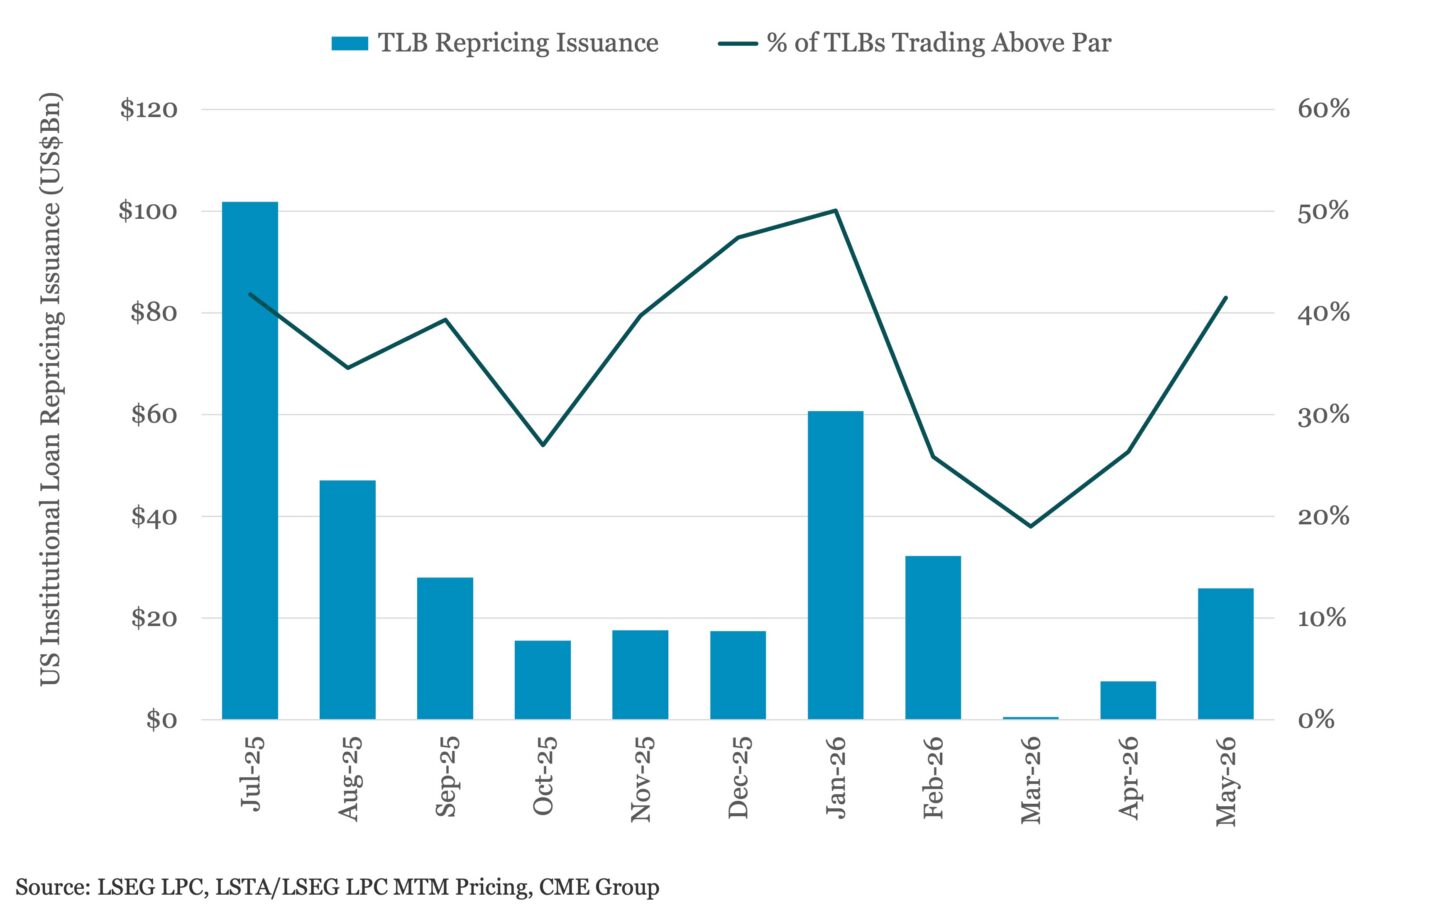
With more than 40% of secondary loans trading above par despite a 96-handled average bid, the repricing trade has come bustling back for issuers able enough and ready to go. At least 24 issuers have effectively repriced US$26bn of existing term debt via mark-to-market in May, a more than threefold increase from April, and there are ten more still working with commits due imminently. Those two dozen issuers extracted about 50bp of weighted average cost savings, regardless of ratings profile. Spread reductions for single-B issuers ranged from 25bp to 75bp, with coupons ranging from S+225bp to S+325bp. For double-B issuers, spread reductions ranged from 25bp to 100bp, with coupons ranging from S+175bp to S+250bp. This latest repricing push has compressed new-issue yields considerably in just one week, with single-Bs averaging about 7.375% and double-Bs printing just below 6%. The push is all the more remarkable given repricings have continued to queue up even as rates markets have moved in the opposite direction. Issuers have benefited from marginally tighter SOFR rates, which tend to mirror the shorter end of the yield curve and have gone nowhere but lower since the beginning of the year. Meanwhile, the longer end of the yield curve (or any tenor beyond three months, that is) has widened, with most of the expansion in the belly of the curve (two- to seven-year tenors). Tack on the probability of a Fed rate hike by the end of the year, which has recently upticked to 50-60% from essentially zero just a month ago, and one can’t help but wonder: how much longer can today’s repricing cycle last? At the end of the day, investors would prefer keeping their capital deployed rather than sitting idle, even if that means collecting lower coupons (or tighter spreads over prevailing treasury rates) on credits they’re familiar with and understand. The leveraged loan market is governed by technicals and fundamentals, and the former seems to be outweighing the latter right now…with issuers reaping most of the benefits.





Latest news

Rate hike expectations ease as term SOFR curve flattens
The CME six-month Term SOFR rate reached a recent high of 3.979% on July 28 before retreating to 3.837% as…

3Q26: New loan assets rise to 44% of total lending, a 3-year high
New loan assets as a proportion of total US loan volume make up 44% of the 3Q26 pipeline to date,…

North American GPs dominant as fundraising accelerates
Our PEI Private Credit 200 ranking also shows capital raising increasing overall – and accelerating especially fast for the largest…