



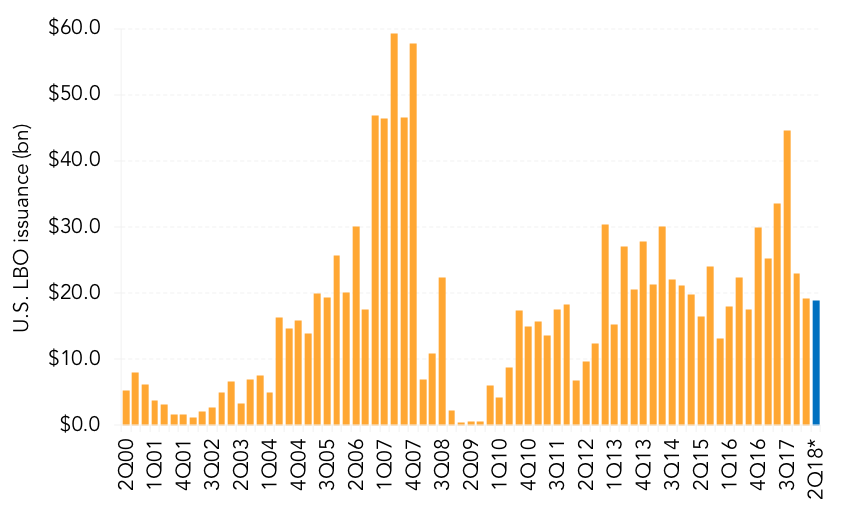
There was a lot of noise around LBO activity last quarter, but in the end 1Q18 U.S. LBO loan issuance totals finished at a modest US$19bn, 17% behind 4Q17’s level of US$22.9bn and 24% behind 1Q17’s US$25.2bn. The good news is that a lot of the LBO announcements from 1Q18 could lead to 2Q18 LBO issuance totals moving higher. Already a healthy US$18.9bn in LBO issuance is slated as completed or in process for 2Q18 including Thomson Reuters Financial & Risk’s US$8.75bn buyout loan. Meanwhile, market participants continued to push further on risk last quarter. Leverage levels on LBO deals averaged 6.39 times in 1Q18 compared to 6.25 times the prior quarter. At the same time, purchase price multiples remained elevated, near 11 times in 1Q18. But with volatility in the broader markets increasing, investors could push back harder on challenged deals. One does not have to look as far as the recent American Greetings buyout loan which saw significant investor pushback. That loan priced at L+450bp with a 98 OID after launching at L+375bp/99.5 as investors were not keen on the company’s declining EBITDA.
Contact: David Puchowsk
David.Puchowski@thomsonreuters.com





Latest news

Rate hike expectations ease as term SOFR curve flattens
The CME six-month Term SOFR rate reached a recent high of 3.979% on July 28 before retreating to 3.837% as…

3Q26: New loan assets rise to 44% of total lending, a 3-year high
New loan assets as a proportion of total US loan volume make up 44% of the 3Q26 pipeline to date,…

North American GPs dominant as fundraising accelerates
Our PEI Private Credit 200 ranking also shows capital raising increasing overall – and accelerating especially fast for the largest…