



US syndicated loan volume took a tumble in 1Q15 to log just over $350 billion, down 27% compared to year ago levels and a more substantive 40% drop over 4Q14 totals. The decline was most notable among leveraged issuers who pushed almost $126 billion through retail syndication during the quarter. Against this total, the good news was that nearly 56% of leveraged issuance represented new loan issuance for asset hungry investors. 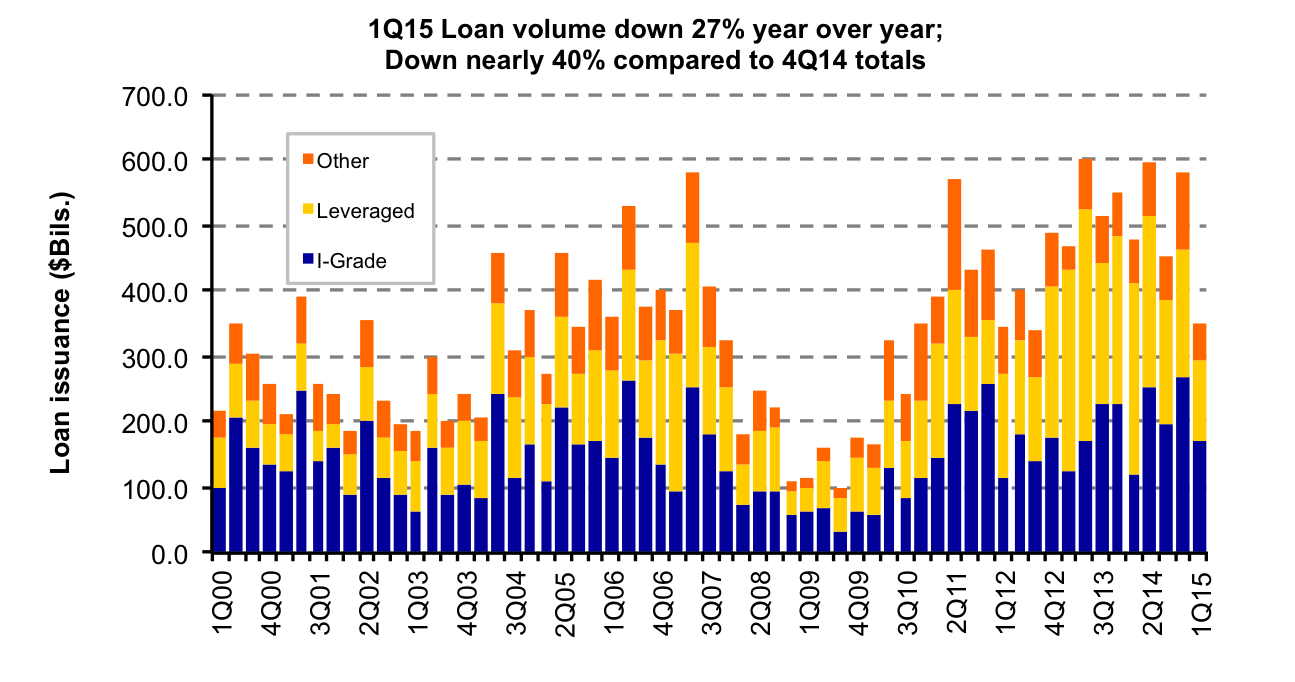 The bad news was that in the absence of refinancings and in the context of regulatory rules that arguably stifled deal flow, leveraged loan volume was down 35% compared to 4Q14 totals and 57% compared to year ago levels. Investment grade issuers had a better story to tell. Just shy of $171 billion, 1Q15 investment grade loan volume was up 41% compared to year ago totals (although down 36% compared to 4Q14) on the back of routine refinancings and a series of noteworthy acquisitions financings. Looking forward to 2Q, leveraged and investment grade lenders alike note that there is little visibility into a building pipeline. Leveraged lenders anticipate the possible return of opportunistic refinancings in the absence of an adequate supply of new, event-driven credits. In contrast, investment grade lenders expect a tapering of refinancings and refreshing of tenors.





Latest news

Multiples on PE buyouts
This quarter marks our integration of SPI by StepStone as the primary source for US buyout valuation metrics for the PE Breakdown.

US Leveraged Loan Issuance Slows to $76.5b in July
The US leveraged loan market has continued to slow from the May level of $104.7b, with approximately $76.5b priced in…
