



LBO leverage levels have started out in 2015 at more conservative levels than we saw in 2014. So far, the average LBO debt to EBITDA level for large corporate and institutional middle market buyout deals has dropped to 6.3 times and 5.3 times respectively, down from 6.55 times and 5.43 times in 2014. 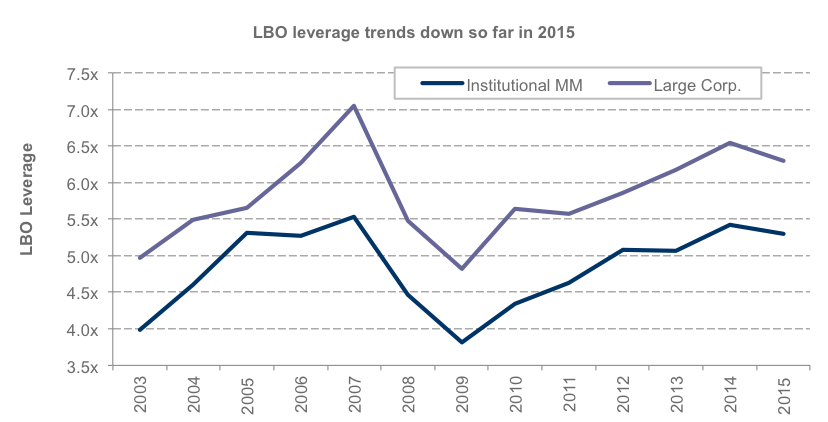 Given more stringent Leveraged Lending Guidance, arrangers indicate they are no longer willing to finance buyout deals that do not fit the guidance set out by the regulators. As a result, the vast majority of buyout deals to hit market so far this year are levered under seven times with the exception of one deal, Advanced Computer Software, which Moodys says is levered around 8 times. However, the credit is in the software space – which benefits from strong revenue visibility and high recurring cash flow generation which could help the credit to meet the regulators deleveraging criteria. Given more conservative leverage, equity checks have risen in 1Q15. Large corporate LBO deals are seeing an average equity check of 36% in 1Q15, up from 33% last quarter while institutional middle market buyout equity checks are averaging 43% this quarter, up from 40% in 4Q14.





Latest news

Multiples on PE buyouts
This quarter marks our integration of SPI by StepStone as the primary source for US buyout valuation metrics for the PE Breakdown.

US Leveraged Loan Issuance Slows to $76.5b in July
The US leveraged loan market has continued to slow from the May level of $104.7b, with approximately $76.5b priced in…
