



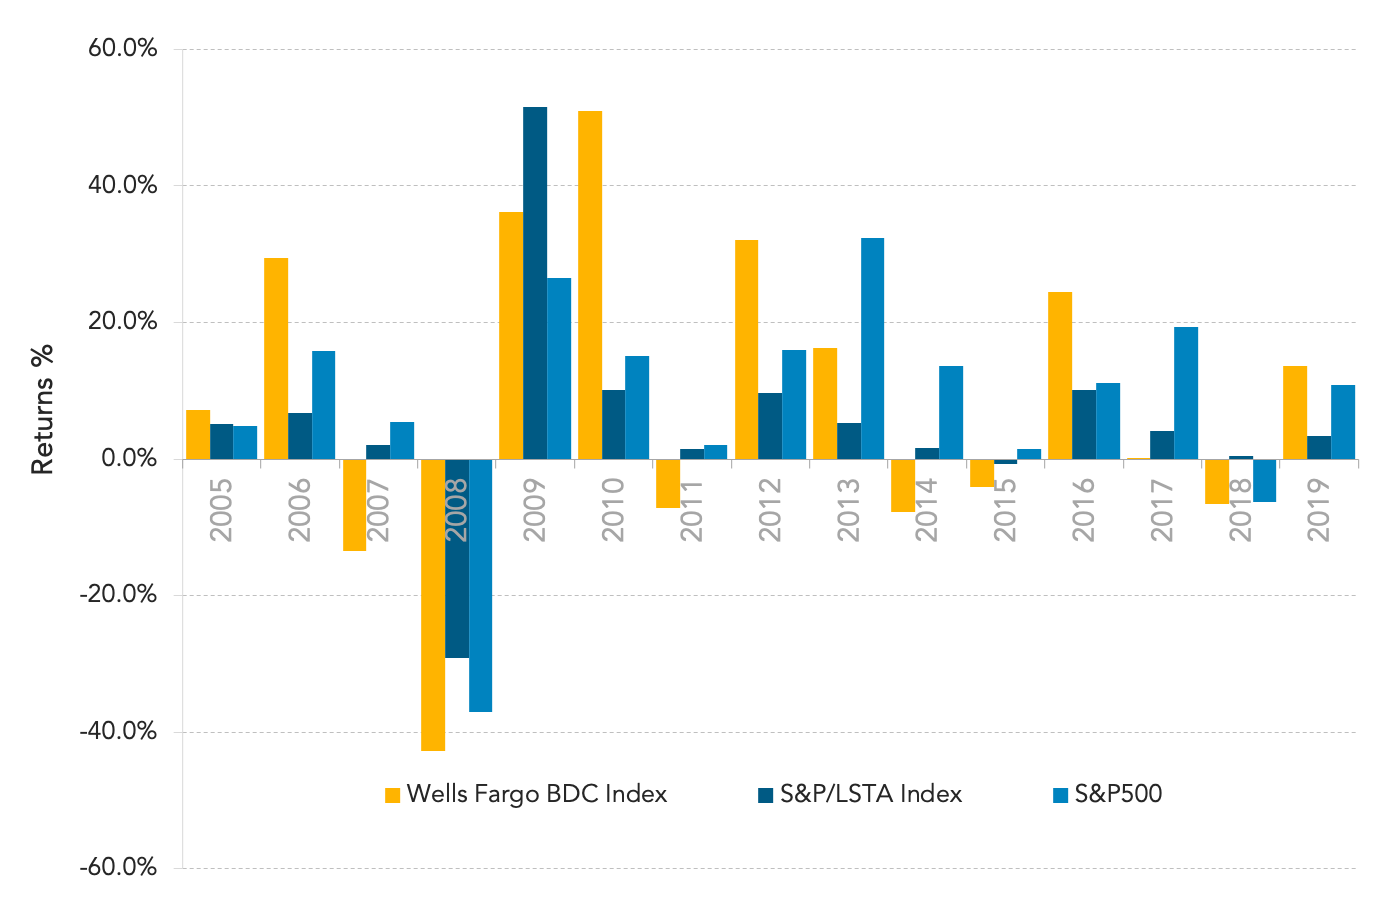
If you were not buying BDC stocks in the dip in December, you are probably feeling remorse because BDC returns are quite stunning so far in 2019. After posting a dismal -6.6% return in 2018 and 0.1% in 2017, returns have gone sky high so far in 2019 with the Wells Fargo BDC Index up 13.7% year to date. This is outpacing the S&P/LSTA Leveraged Loan Index at 3.3% and the S&P500 at 10.9% year to date. Back in late December, only 6 public BDCs were trading near book value or higher with the average price to net asset value per share residing at 0.76x across the publicly traded universe. But in February, the average price to NAV has shot back up to 0.9x with 14 public BDCS now back to book value or higher. New Mountain took advantage of the rebound and was the first BDC to issue public equity this year. Over 35 public BDCs have already produced double digit returns this year with 8 producing returns well north of 20% including GLAD, GAIN, MRCC, and FSK to name a few. BDCs are currently in the midst of earnings season, with 16 BDCs already releasing 12/31/18 filings so far. The landscape remains bifurcated with high quality managers showing continued realized gains and strong originations while lower tier BDCs are still struggling with some problem loans and losses. While dividend cuts have been few and far between since Libor has risen over the 2.5% area, Harvest Capital did lower its dividend by 15.8% stating a very competitive investment environment.
Contact: Fran Beyers
frances.beyers@refinitiv.com





Latest news

Rate hike expectations ease as term SOFR curve flattens
The CME six-month Term SOFR rate reached a recent high of 3.979% on July 28 before retreating to 3.837% as…

3Q26: New loan assets rise to 44% of total lending, a 3-year high
New loan assets as a proportion of total US loan volume make up 44% of the 3Q26 pipeline to date,…

North American GPs dominant as fundraising accelerates
Our PEI Private Credit 200 ranking also shows capital raising increasing overall – and accelerating especially fast for the largest…