



Issuance conditions have been enticing, and with predictions of a rise in interest rates in mid-2015, opportunistic HY bond issuers have been streaming into the market lately to lock in relatively cheap financing. This week’s pricing of Springleaf Finance Corp’s $700 million deal brought year-to-date volume to $304.6 billion, on par with where record-breaking 2013 was at this time last year.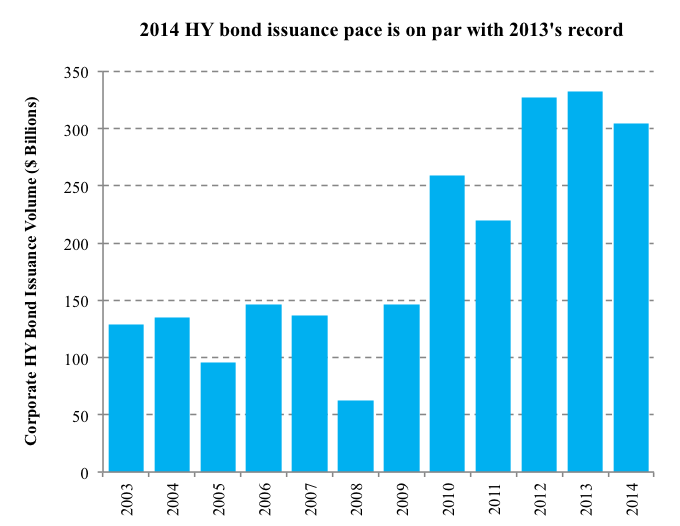 This is especially impressive given that at the end of 3Q14, 2014’s issuance pace lagged that of 2013’s by 3%. October 2014 priced $27 billion of HY bonds, and November 2014-to-date has priced $27.97 billion. To put these numbers in context, over the last ten years, October averaged issuance volume of $16.28 billion, and November averaged $18.53 billion of HY bonds. 4Q14 has thus far been successful in combating a rather lackluster 3Q14 when warnings of “stretched valuations,” geopolitical tensions, fears of a slowdown in the global economy and especially of deflation in the Euro zone, all wreaked havoc on the relatively risky asset class and led to record outflows. At the end of July, 2014’s issuance pace was seven percent ahead of that of 2013’s. Underliers





Latest news

Rate hike expectations ease as term SOFR curve flattens
The CME six-month Term SOFR rate reached a recent high of 3.979% on July 28 before retreating to 3.837% as…

3Q26: New loan assets rise to 44% of total lending, a 3-year high
New loan assets as a proportion of total US loan volume make up 44% of the 3Q26 pipeline to date,…

North American GPs dominant as fundraising accelerates
Our PEI Private Credit 200 ranking also shows capital raising increasing overall – and accelerating especially fast for the largest…