



At $940 billion, leveraged loan issuance fell 17 percent from 2013’s record, as opportunistic refinancings fell 38 percent to $547 billion on the back of periods of volatility and slowing retail demand. Although top line figures were dragged down by the decline in refinancing volume, the 21 percent jump in leveraged M&A activity in 2014 brought much needed supply, making up 28 percent of leveraged lending, up from 19 percent in 2013. 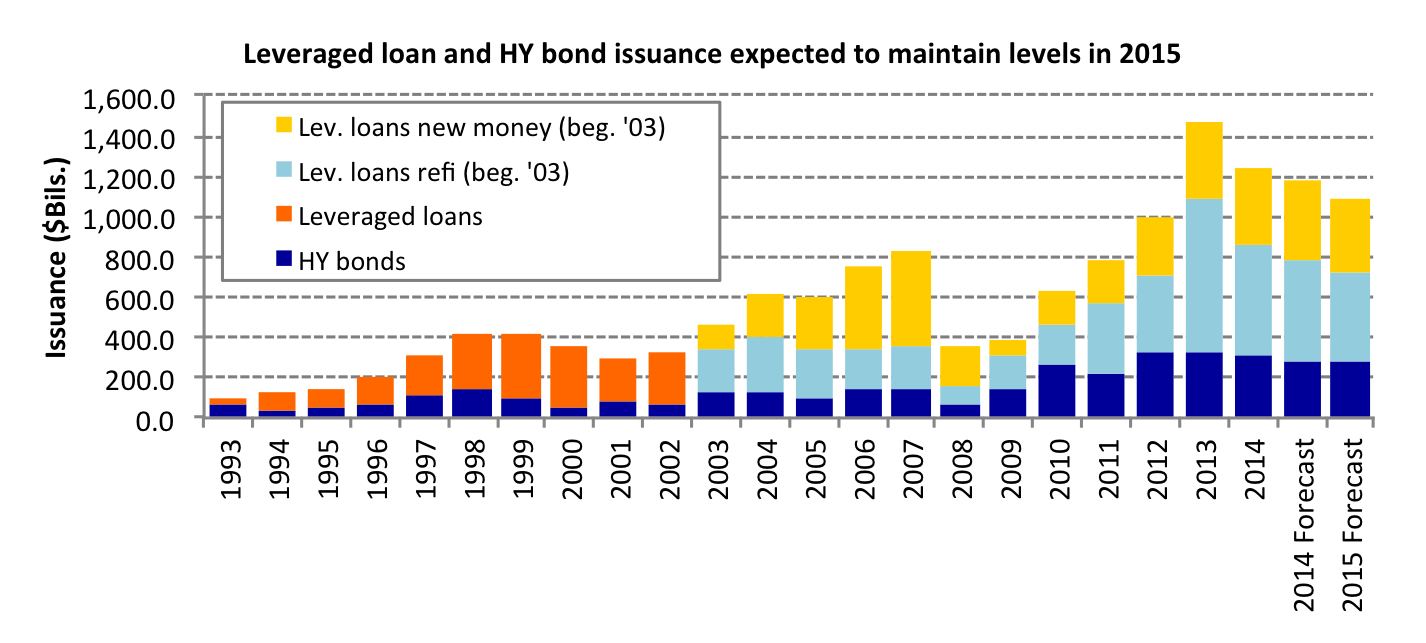 Sellside sources surveyed in Thomson Reuters LPC’s Quarterly Survey expect that M&A may make up 30% or even 40% of issuance in 2015. In addition, they expect refinancing activity to decline while new money stays steady. Including financings for Burger King and Community Health Systems, leveraged M&A activity reached $267 billion, up 21 percent from 2013 and ranking only below 2007’s record of $357 billion. In 2007, LBO financings reached $207 billion compared to this year’s $92 billion. Instead, corporates in the leveraged space borrowed $116 billion to back M&A transactions in 2014, up 31 percent from 2013. Meanwhile, high yield bond issuance reached $308 billion, down from 2013’s $332 billion record and is expected to be fairly steady or to drop less than 10 percent in 2015 according to LPC’s survey. Underliers





Latest news

Rate hike expectations ease as term SOFR curve flattens
The CME six-month Term SOFR rate reached a recent high of 3.979% on July 28 before retreating to 3.837% as…

3Q26: New loan assets rise to 44% of total lending, a 3-year high
New loan assets as a proportion of total US loan volume make up 44% of the 3Q26 pipeline to date,…

North American GPs dominant as fundraising accelerates
Our PEI Private Credit 200 ranking also shows capital raising increasing overall – and accelerating especially fast for the largest…