



Leverage levels continued to increase last quarter which brought year-to-date averages close to the levels last seen in 2007. This had some market participants throw up caution signs wondering if it was a bad case of déjà vu. But there are a few caveats to the 2014 numbers.For one, LBO issuance tallied $207.6 million in 2007, taking up a staggering 30 percent of leveraged volume.
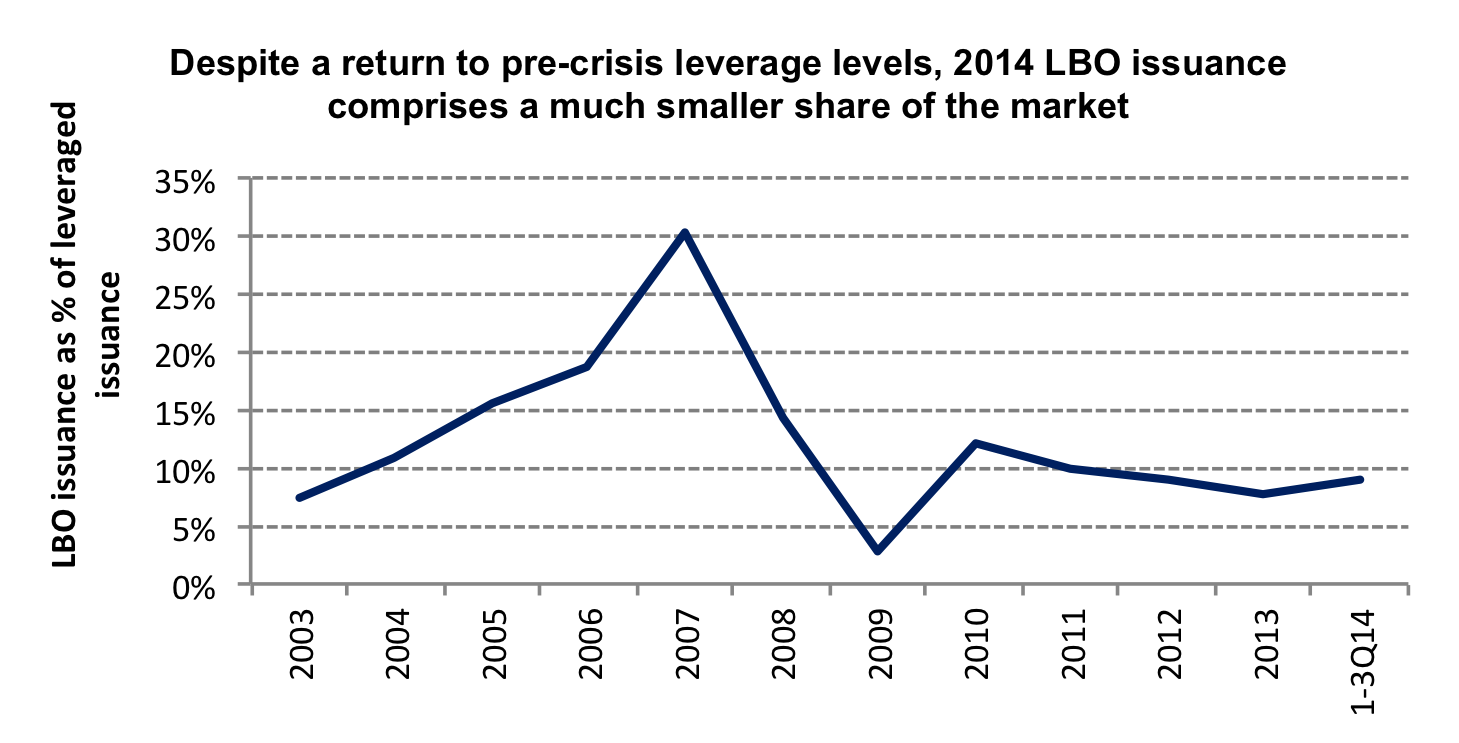
This year, buyout issuance was $86.5 billion and a much smaller 9 percent of leveraged issuance through 3Q.So although 2014 leverage levels are at high levels similar to 2007, these riskier loans are taking up a much smaller portion of the leveraged market now compared to then. Leveraged buyout issuance has decreased this year as purchase price multiples have crept up leaving sponsors competing with balance sheet rich corporates. 1-3Q14 sponsored activity saw a 43 percent drop in loan financings year over year. In contrast, leveraged corporates have raised over $121 billion in M&A financings so far this year, a 42 percent increase over 1-3Q13 totals.Sponsored market share has also declined relative to 2007. Back then, sponsored issuance took up approximately 53 percent of leveraged lending. This year, sponsored lending comprises 41 percent of leveraged lending. Underliers





Latest news

Rate hike expectations ease as term SOFR curve flattens
The CME six-month Term SOFR rate reached a recent high of 3.979% on July 28 before retreating to 3.837% as…

3Q26: New loan assets rise to 44% of total lending, a 3-year high
New loan assets as a proportion of total US loan volume make up 44% of the 3Q26 pipeline to date,…

North American GPs dominant as fundraising accelerates
Our PEI Private Credit 200 ranking also shows capital raising increasing overall – and accelerating especially fast for the largest…