



3Q16 Loan volume down nearly 40% q-o-q, 1-3Q16 totals down 11% y-o-y
Issuance in the US loan market got off to a rough start in 3Q16 to dampen results for the full quarter while leaving lenders and investors hungry. At US$372 billion, 3Q16 volume was down nearly 31% year over year and more substantial 38% compared to 2Q16 results, to bring 1-3Q16 totals to US$1.3 trillion, the lowest nine month total since 2012. The absence of new money lending factored prominently in the lower figures. At less than US$230 billion, 3Q16 investment grade loan volume was down 55% compared to 2Q16 results to bring 1-3Q16 totals to roughly US$580 billion, down 7% compared to the same time last year.
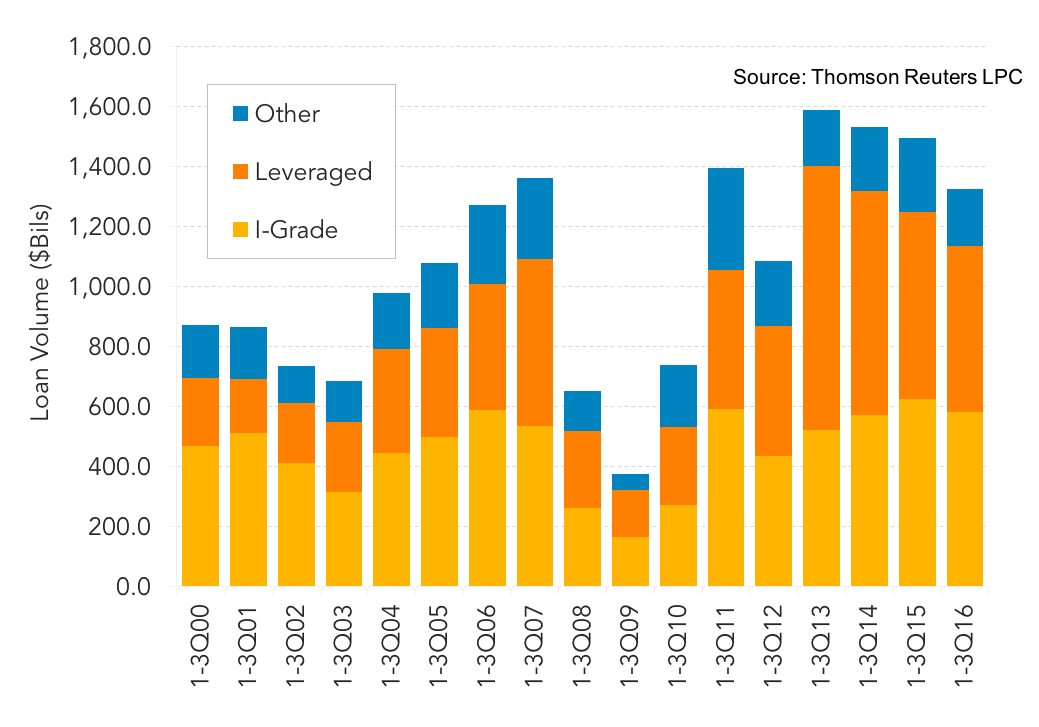
Less than US$20 billion or under 15% of total investment grade issuance for the quarter represented new money. In turn, at US$137 billion 1-3Q16 new investment grade loan assets represented less than 25% of year to date lending. Moreover, in the absence of large, transformative acquisition deals, high grade M&A loan financings are down 26% year to date at roughly US$100 billion. Leveraged lenders also had a tough time. At just over US$187 billion 3Q16 leveraged loan volume was down 21% quarter over quarter to bring 1-3Q16 totals US$555 billion, 11% down compared to year ago totals. More significantly, although roughly 53% of year to date leveraged issuance represented new loan assets, only US$203 billion represented financing to back M&A transactions, while the balance represented a flurry of upsizings and loan for bond takeouts.
Contact: Maria Dikeos
maria.dikeos@thomsonreuters.com





Latest news


Software, consumer-related direct lending deals fell in H1'26
The software and technology sector, the second-most-active sector in 2025 at 17% of total deal activity, slid to fifth place in the first half of 2026.

Unconquered Territory
With most of the map still unexplored, there’s room for a sequel.