


US LBO Capital Structures: In world of high valuations, increased senior leverage and equity prevail in 3Q24

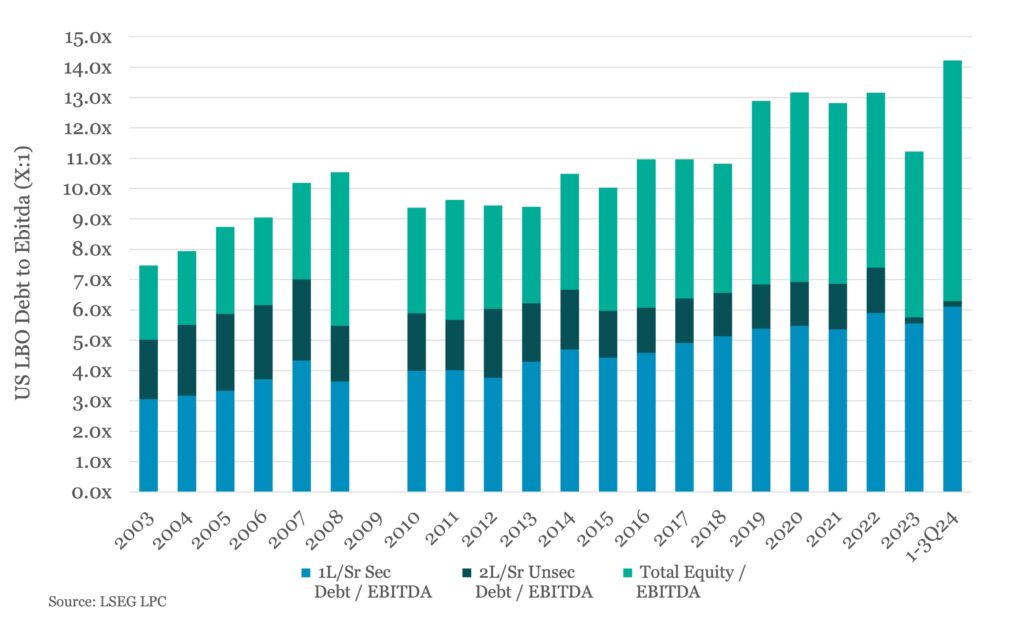
While pro forma leverage and equity contributions for US large cap LBO transactions have remained elevated, and continue to move higher and parallel with valuations despite higher rates, capital structures have evolved accordingly. Average senior leverage multiples (through first-lien/secured debt) have gradually expanded from the customary 4.0-5.0x area of yesteryear toward the 6.0x area today, a threshold that was previously (and loosely) considered the upper bound for total maximum leverage altogether, for anyone who still laments those old leveraged lending guidelines from the OCC. Equity contributions (as a percentage of total capitalization) have generally bracketed 50% over the past six consecutive quarters. These trends come as no surprise…with valuations at historical highs and the higher cost of incremental leverage via junior-lien and/or unsecured debt prohibitively expensive, acquirers have committed more equity and raised more senior secured first-lien debt to fill the void. Senior stretch, all-first-lien LBO structures have therefore become increasingly common, while the incremental leverage provided through a more customary bank/bond or 1L/2L structure has largely eroded to 0.25-0.50x EBITDA or less, versus the 1.0-2.0x area when rates were significantly lower. The higher rate environment has impacted not only capital structures but also acquirers’ returns, at least in the short-to-medium term…and although the cost of financing an LBO is notably steeper than it once was, at least for now, that price may still be way cheaper than the opportunity cost of not owning the asset at all. And market conditions always change. As leveraged capital markets anticipate a more stable, downward rate cycle, many of today’s capital structures are expected to get recapitalized, where second-lien loans and/or unsecured bonds will refill the gap they created.
Contact: Chris Piccirillo
chris.piccirillo@lseg.com





Latest news

Multiples on PE buyouts
This quarter marks our integration of SPI by StepStone as the primary source for US buyout valuation metrics for the PE Breakdown.

US Leveraged Loan Issuance Slows to $76.5b in July
The US leveraged loan market has continued to slow from the May level of $104.7b, with approximately $76.5b priced in…
