



Chart
Download Data
[wpdm_package id=’74573′]
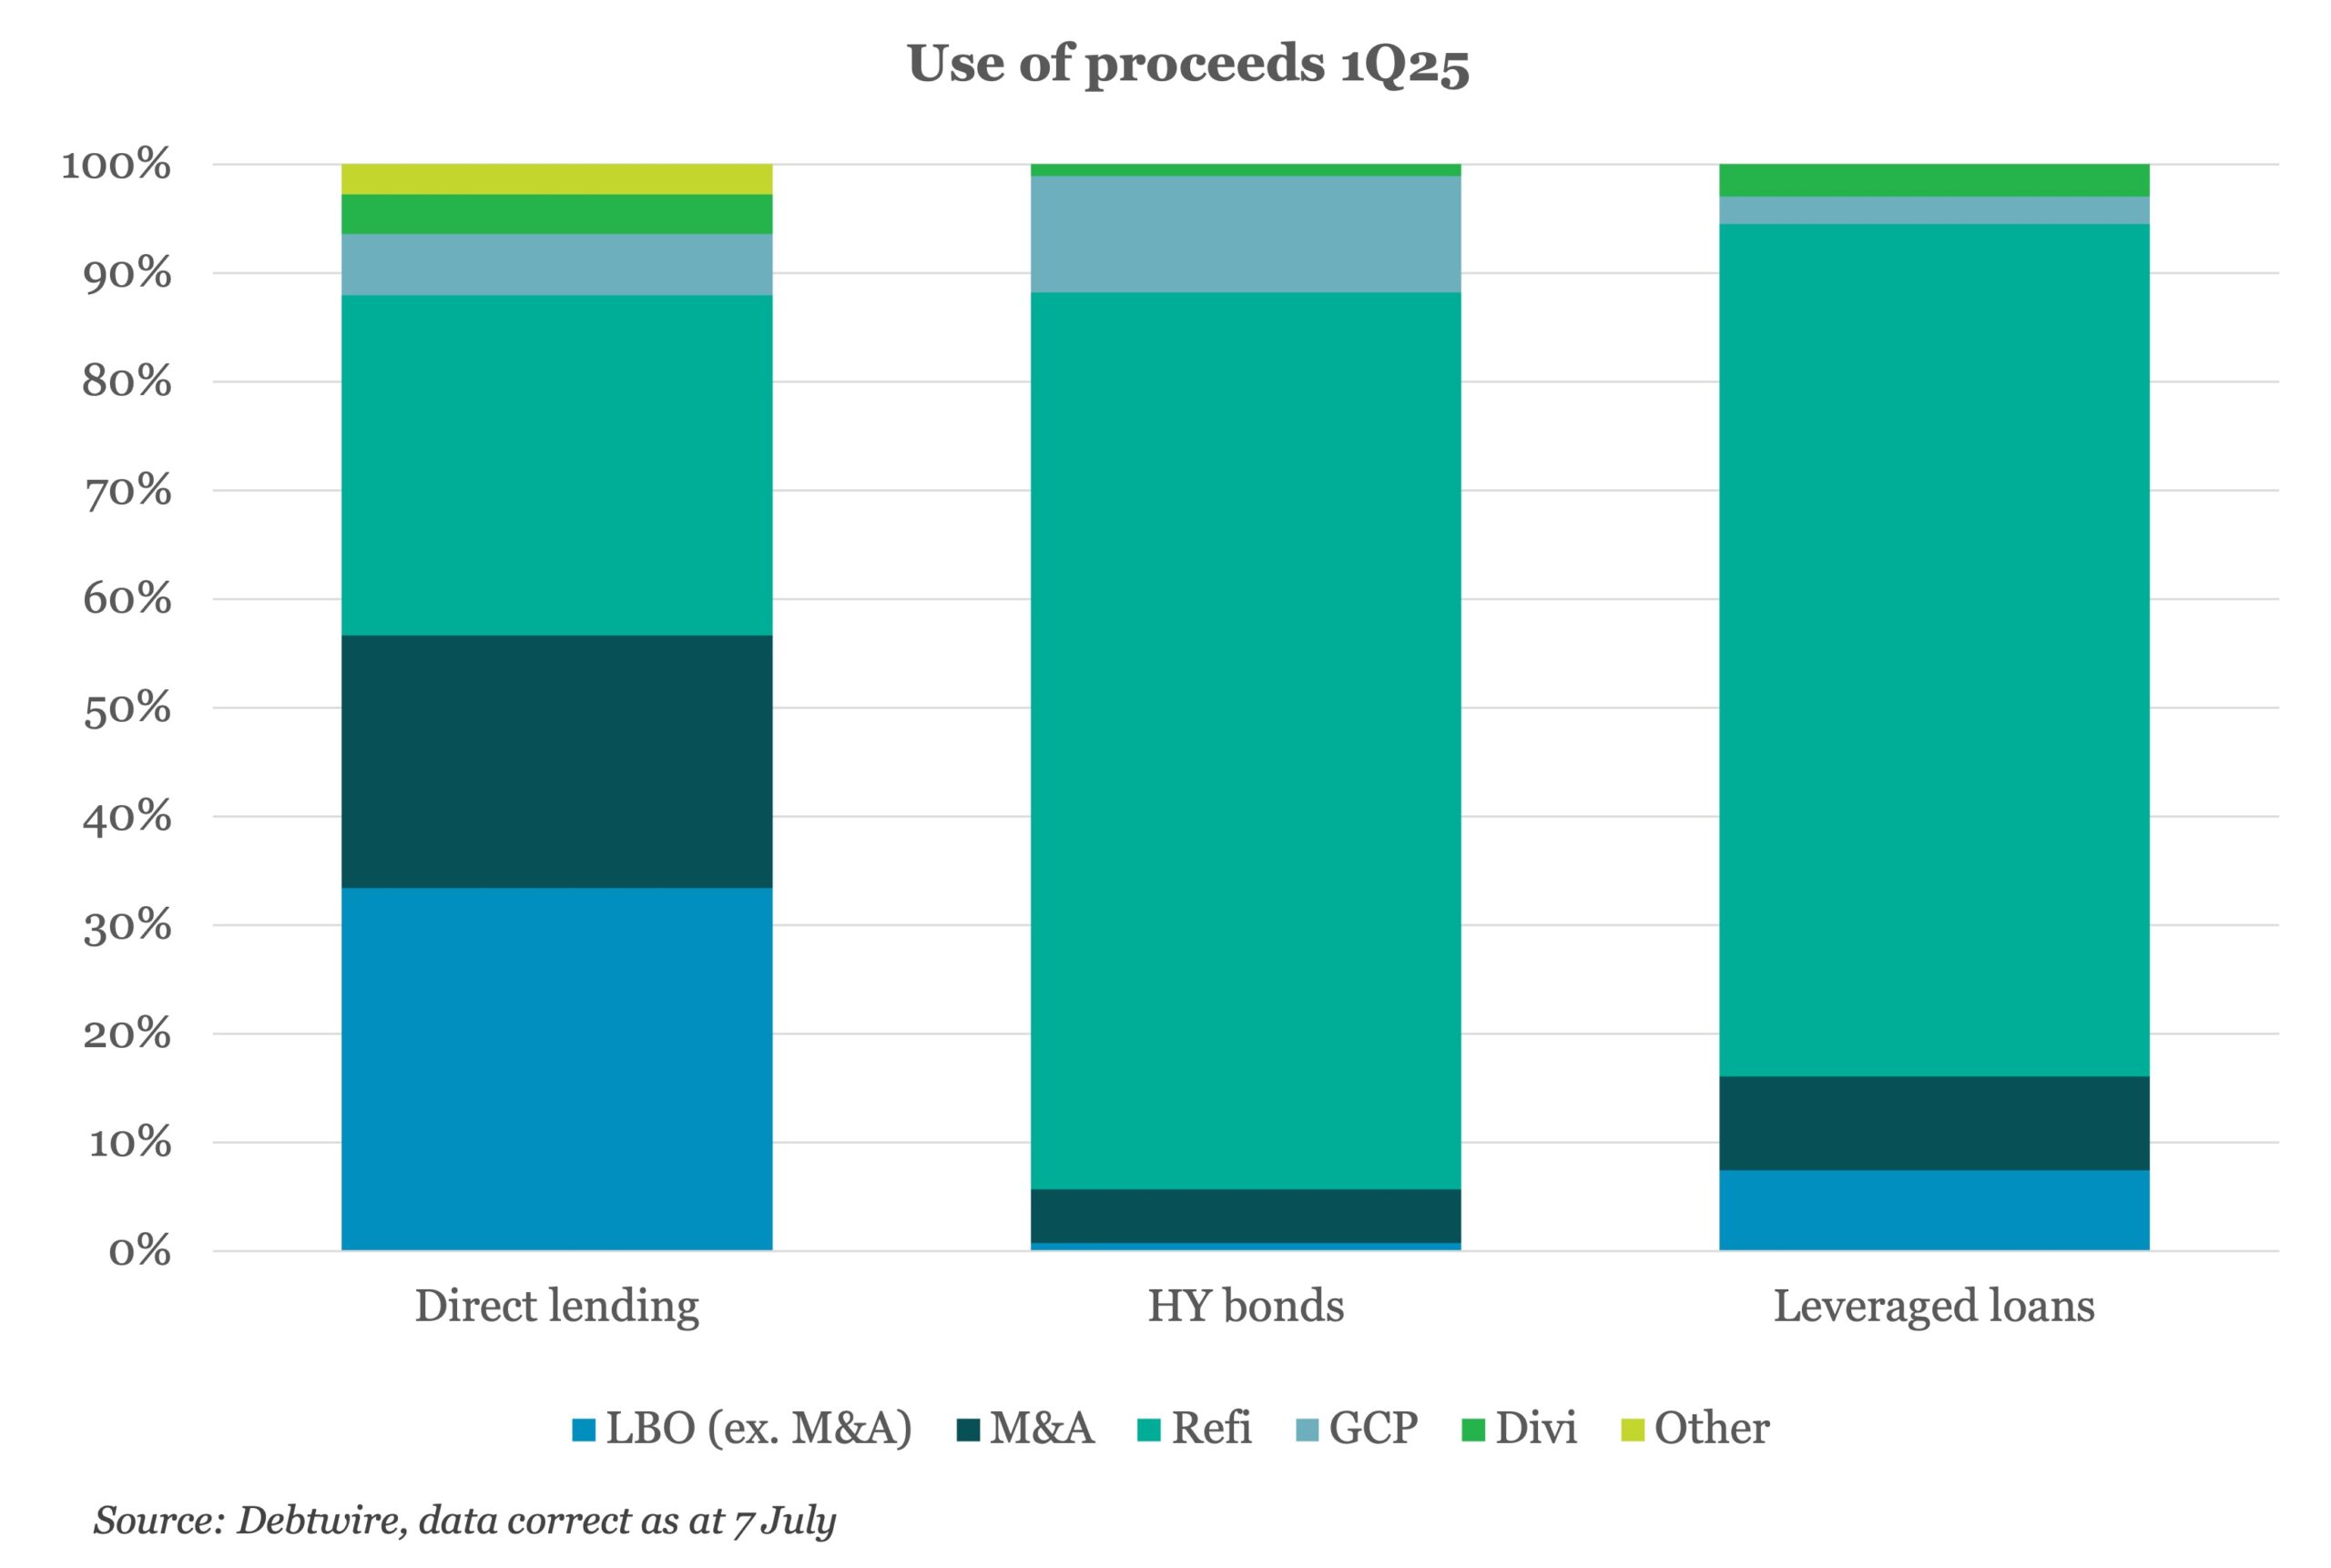
In 1Q25, direct loans reached a total deal volume of USD 66bn, lower than the USD 363bn recorded in the institutional leveraged loan market but closely matching high-yield bond volumes of USD 65.8bn. Despite lagging leveraged loan volumes overall, direct lending activity was heavily driven by leveraged buyout (LBO) and other M&A transactions, which accounted for 57% (USD 37.39bn) of total issuance in 1Q25, significantly exceeding refinancing deals, which made up just 31% (USD 20.7bn) of the volume.
Notably, 99% of the USD 36.9bn in M&A and LBO-related volume amounting was backed by financial sponsors, underscoring the dominant role played by sponsor-led transactions for the direct lending issuance in 1Q25.
By contrast, M&A and LBO transactions accounted for only USD 36bn, or 16%, of total volume for leveraged loans, and just 6%, or USD 3.75bn, of the high-yield bonds in 1Q25. Direct lending has become the fundamental financing source for M&A for middle-market companies. Yet more capital is funneled via private credit during times of elevated macroeconomic volatility.
“The rise in M&A volumes can largely be attributed to ongoing consolidation across the industry,” said Vishal Rana, Managing Partner at Sarva Capital. “Family-run businesses, such as pest control firms and spas, are increasingly being institutionalized and brought together under unified platforms, a trend that’s driving much of the current M&A activity.”
M&A, including LBOs, contributed over 50% of overall direct lending volume in 2022 and 2023, with some slowdown in 2024, when it made up for around 35% of overall volume.
1Q25 has shown some signs of recovery, with volume rising to 57% as compared to 38% in 1Q24, according to Debtwire data.
Technology leading the way
The technology sector led M&A and LBO deal activity in 1Q25, accounting for 39% of the USD 37.4bn in total volume. The financial institutions and industrial sectors followed, each contributing a 16% share.
“There’s a wave of innovation sweeping across the industry, with the technology sector at the forefront of the AI revolution, driving significant capital flows into tech,” said Rana. “Financial institutions are also evolving, integrating AI to remain competitive, while industrial companies are increasingly reshoring production under the ‘Make in America’ push championed by the Trump administration.”
Senior unitranche vs Term loan B margins
In 1Q25, average margins on senior unitranche loans stood at 513bps, well above the 325bps average for term loan B (TLB). Although both have seen spreads narrow since their 2022–2023 highs, the 188bps gap underscores direct lending’s pricing strength. According to Rana, margins have tightened due to a broader slowdown in market activity.
Looking ahead
Rana expressed optimism about the outlook for the remainder of the year, noting that activity in the private credit market is expected to pick up. He added that with the recent passage of the Big Beautiful Bill Act, the next two to three years appear promising for deal-making, even amid some expected market volatility.
For access to our comprehensive news, analysis and data on the global loan and bond markets, please subscribe to Debtwire.
(Past performance is no guarantee of future results.)



Latest news

US Leveraged Loans Return 3.36% to Investors YTD
The Bloomberg US Leveraged Loan Index (Ticker: LOAN) returned 0.96% in August and has gained an additional 0.28% through September…

PE dry powder
The capital that is being raised is flowing overwhelmingly to the largest, most established managers.

Middle market debt held by BDCs vs High yield vs Treasury yields
The blue line represents the current dividend yield of the VanEck BDC Income ETF (BIZD), which stood at 11.7% as…