



- Click here to access Bloomberg’s US Leveraged Loan Index Report
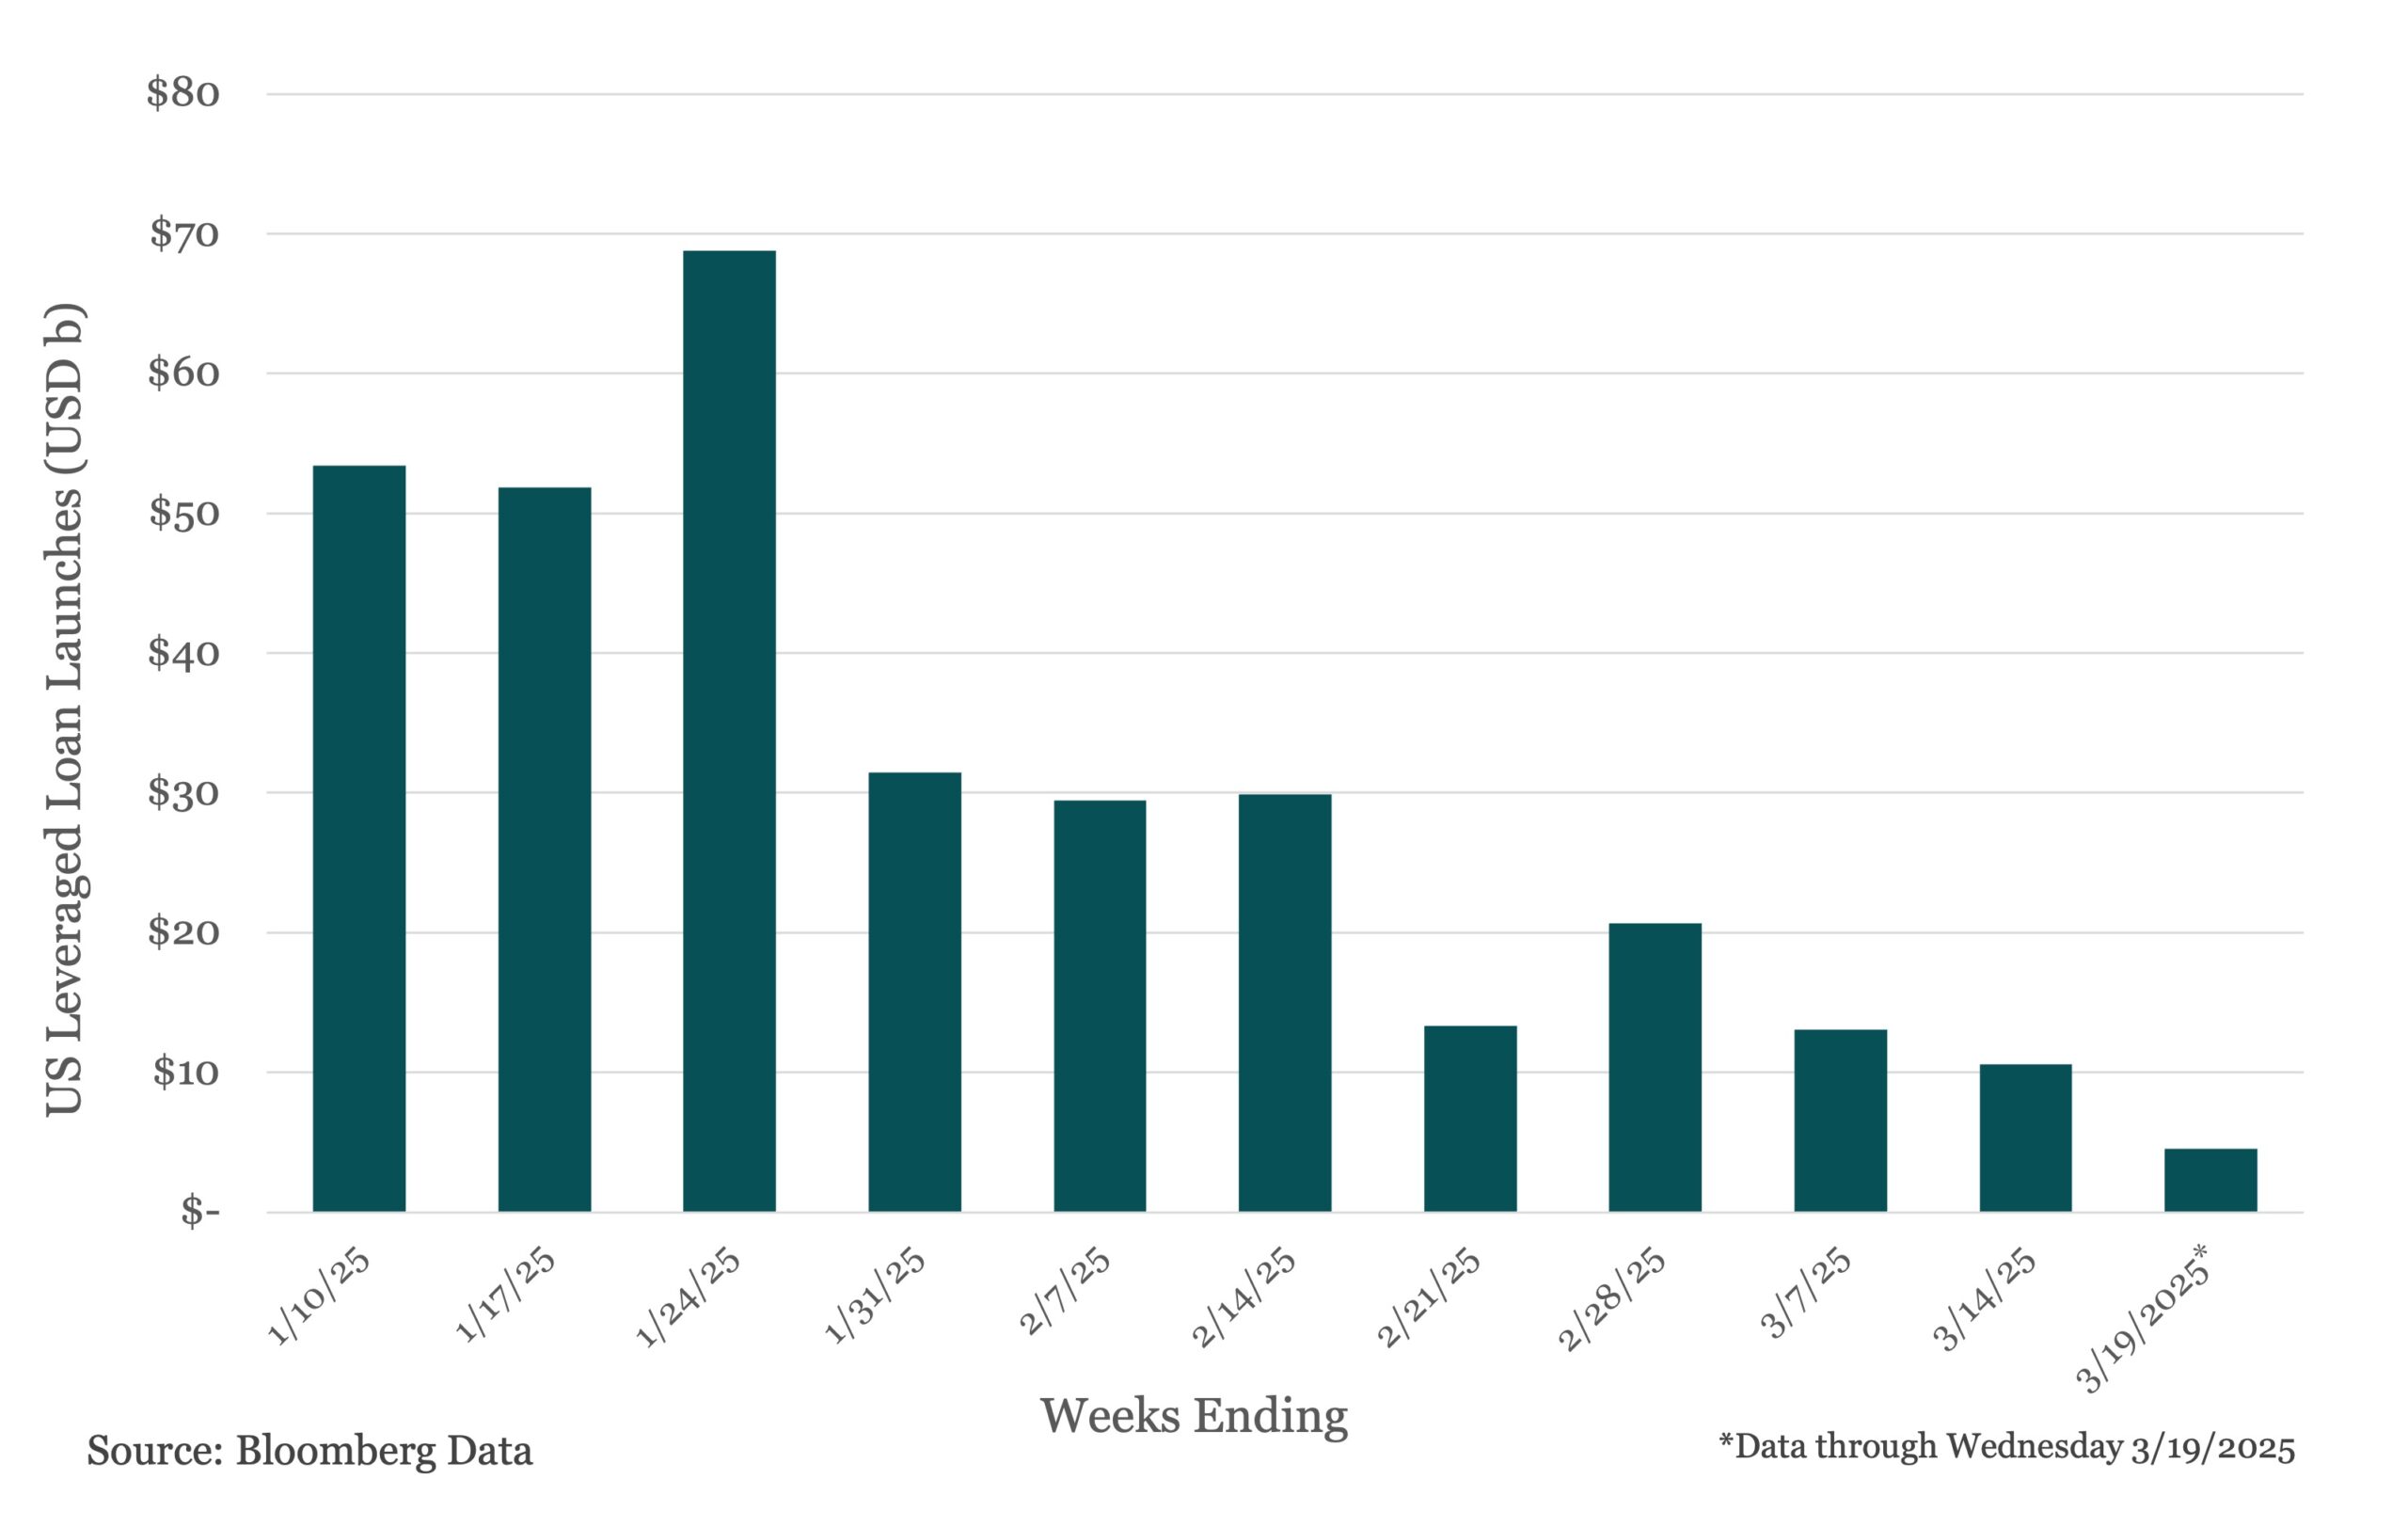
After a record start, US leveraged loan launches last week fell to their lowest level this year at just $10.56b. This week, just $4.51b has launched through March 19th, as the pace of issuance over the last four weeks has slowed to an average of $14.4b compared to an average of $51.4b during the first four weeks of the year.
With prices declining in the secondary market amid greater economic uncertainty, issuers have been forced to the sideline, at least briefly stemming the tide of repricings that has been flooding the market since early last year. The Morningstar LSTA US Leveraged Loan Index declined to an average bid of 96.43 as of March 18th from a high of 97.7 in January – the lowest level seen since August 2024.
Cracks in the rally continued to emerge, as several deals have seen pricing widen of late, including SolarWinds’ $2.225b TL backing the company’s acquisition by Turn/River Capital LP. Some deals were also pulled from syndication amid market volatility, including NorthRiver Midstream’s $810mm TL repricing and Pursuit Aerospace’s $950mm loan to refinance existing private debt.
Contacts:
Vincent Daigger
vdaigger@bloomberg.net
Lara Wieczezynski
wieczezynski@bloomberg.net





Latest news

Rate hike expectations ease as term SOFR curve flattens
The CME six-month Term SOFR rate reached a recent high of 3.979% on July 28 before retreating to 3.837% as…

3Q26: New loan assets rise to 44% of total lending, a 3-year high
New loan assets as a proportion of total US loan volume make up 44% of the 3Q26 pipeline to date,…

North American GPs dominant as fundraising accelerates
Our PEI Private Credit 200 ranking also shows capital raising increasing overall – and accelerating especially fast for the largest…