



- Click here to access Bloomberg’s US Leveraged Finance Chartbook
- Click here to access Bloomberg’s US Leveraged Loan Index Report
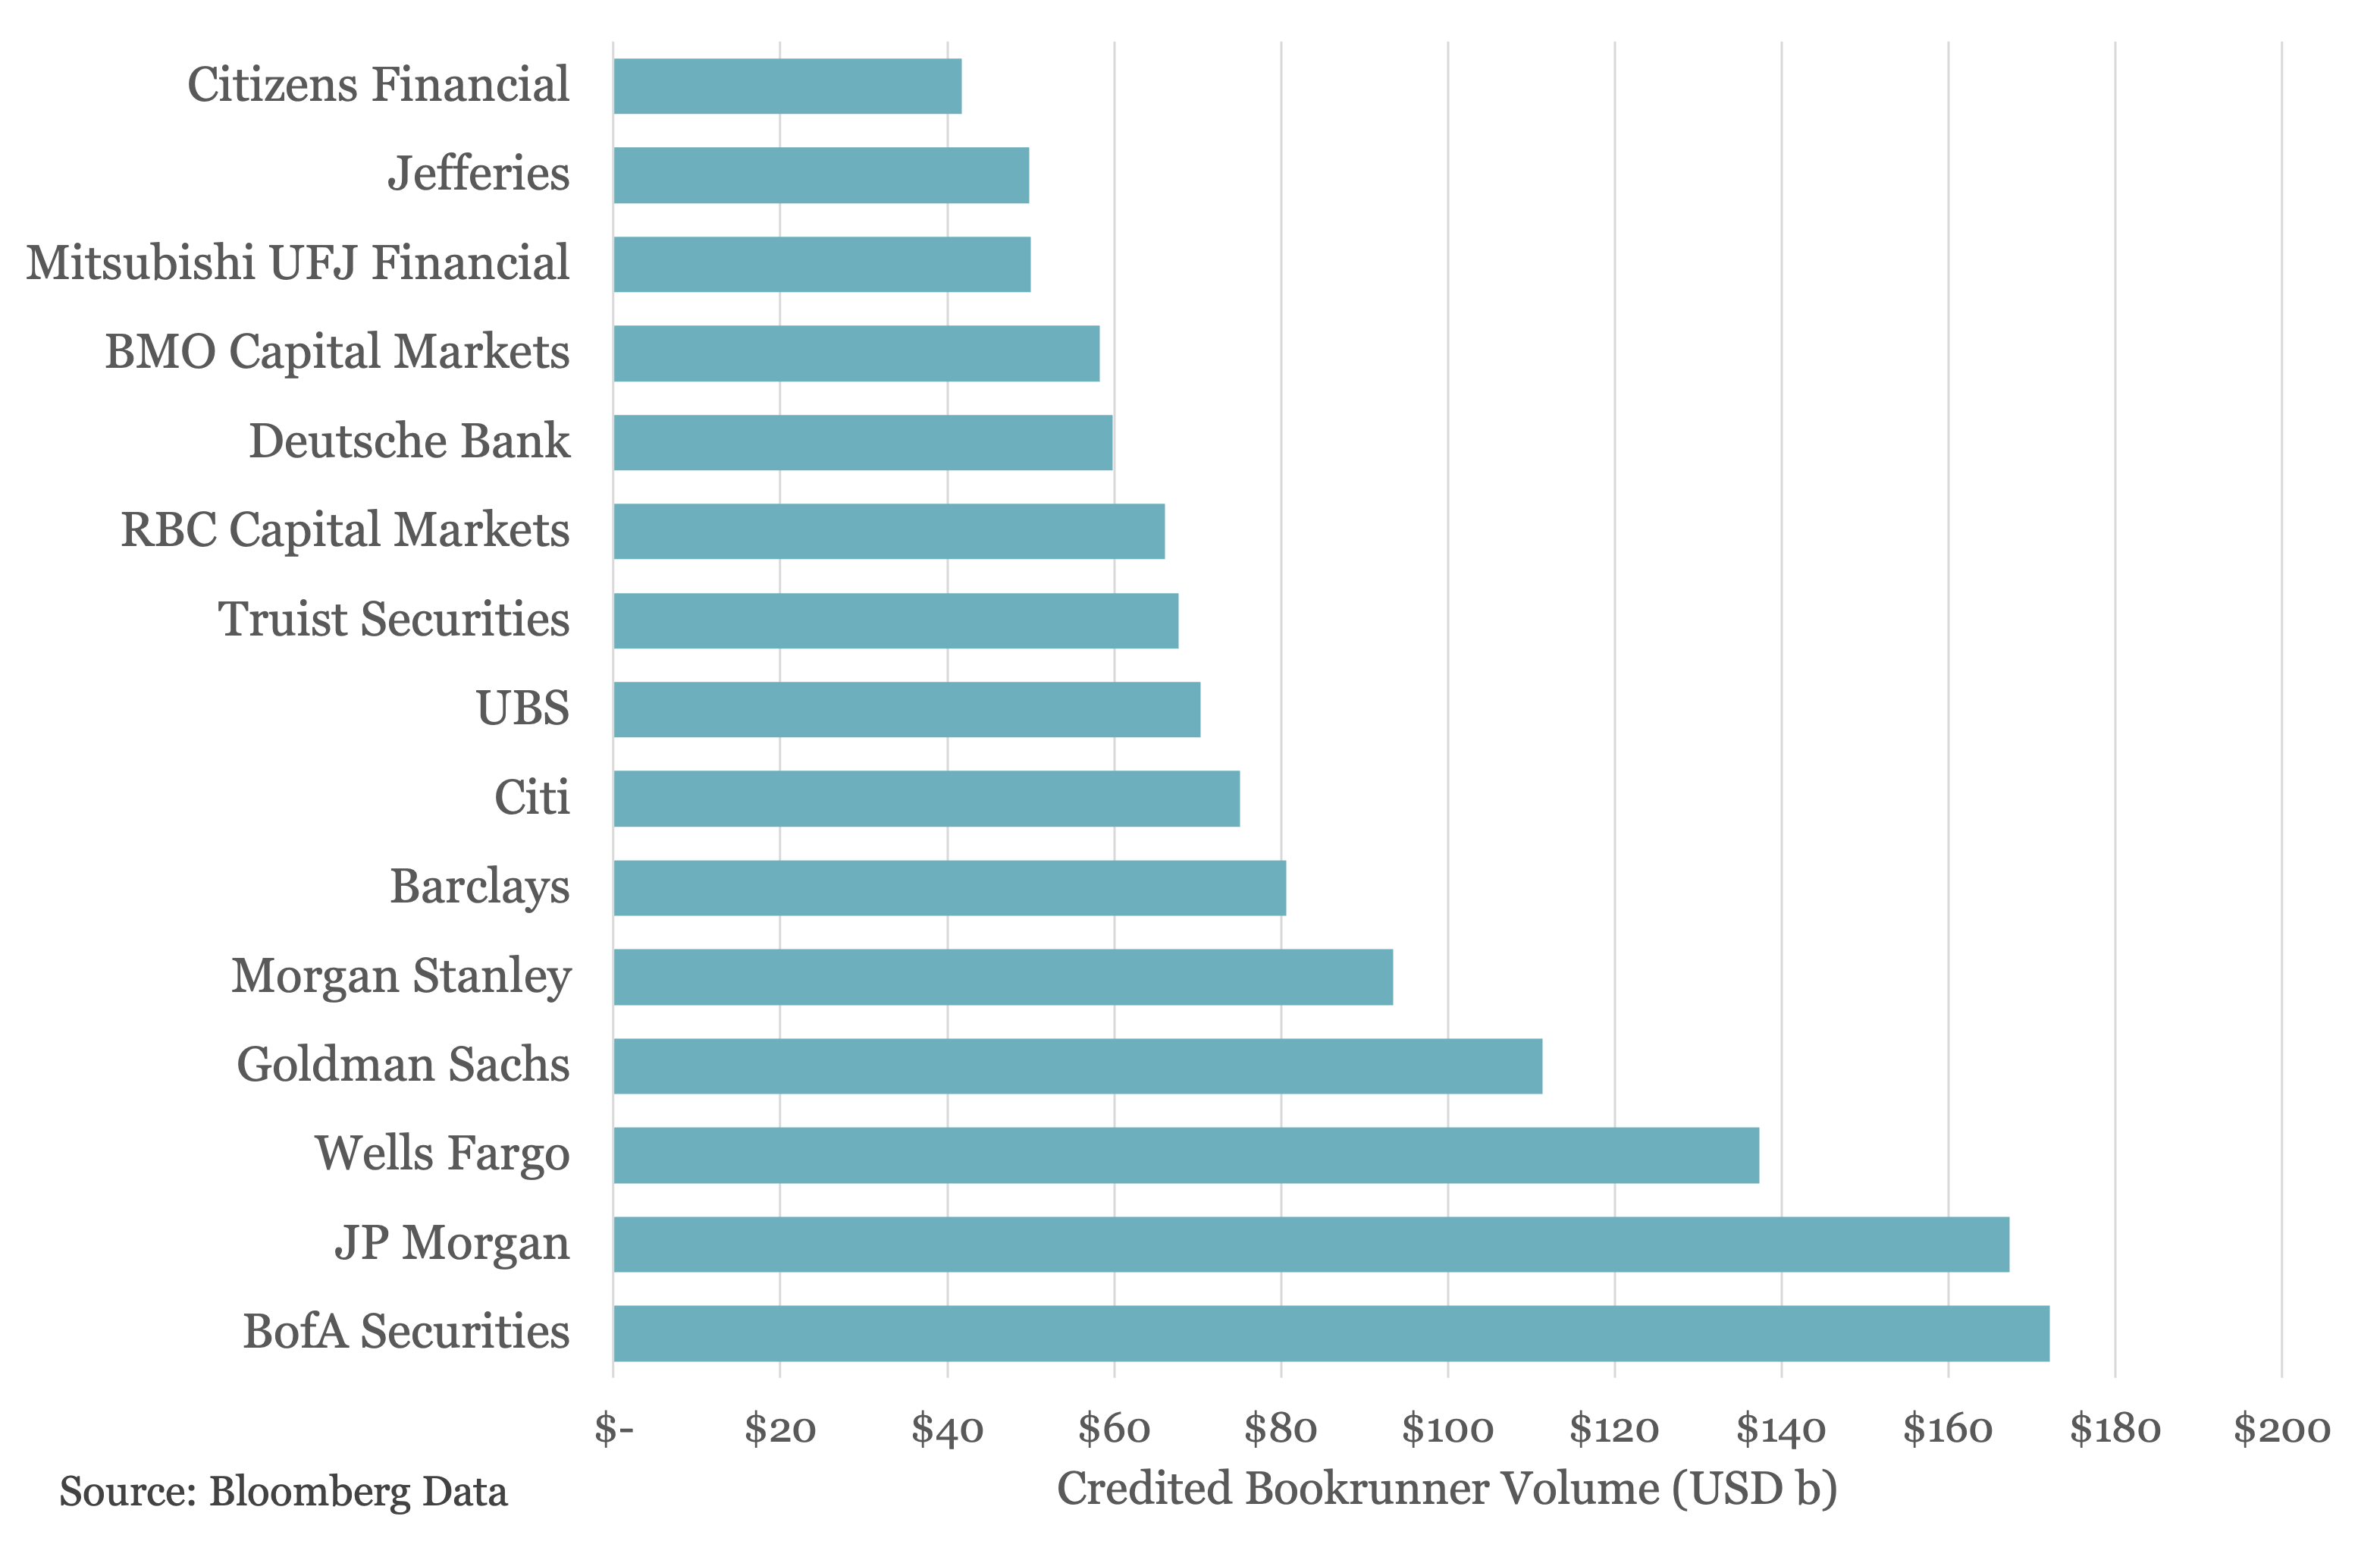
Amid record issuance in the leveraged loan market in 2024, where institutional issuance exceeded $1.33t, Bank of America was the most active bookrunner, participating in 953 US leveraged loan deals with an annual credited bookrunner volume of over $172b. Following BofA was JP Morgan at $167b across 961 deals, Wells Fargo with 733 deals for $137b, and Goldman Sachs logging 648 deals for $111b. The ranks among the top four bookrunners remained unchanged from a year ago.
While the top four bookrunners accounted for nearly 30% of the total bookrunner volume credited in 2024, it represented a decline of 5% from last year, as BofA, JPM and Wells all saw their share of the total decline (-2.82%, -1.59%, and -1.35%, respectively).
At the same time, bookrunners such as UBS saw their share of the market improve by 1.92% to 3.43% and jumped from the 22nd rank to the 8th after the bank completed its acquisition of Credit Suisse earlier in the year. Other notable gainers include Morgan Stanley (0.96% share gain, improving one spot to the 5 rank) and Jefferies (0.70% share gain, improving 3 spots to the 14 rank).
Contacts: Vincent Daigger
vdaigger@bloomberg.net





Latest news

Rate hike expectations ease as term SOFR curve flattens
The CME six-month Term SOFR rate reached a recent high of 3.979% on July 28 before retreating to 3.837% as…

3Q26: New loan assets rise to 44% of total lending, a 3-year high
New loan assets as a proportion of total US loan volume make up 44% of the 3Q26 pipeline to date,…

North American GPs dominant as fundraising accelerates
Our PEI Private Credit 200 ranking also shows capital raising increasing overall – and accelerating especially fast for the largest…