



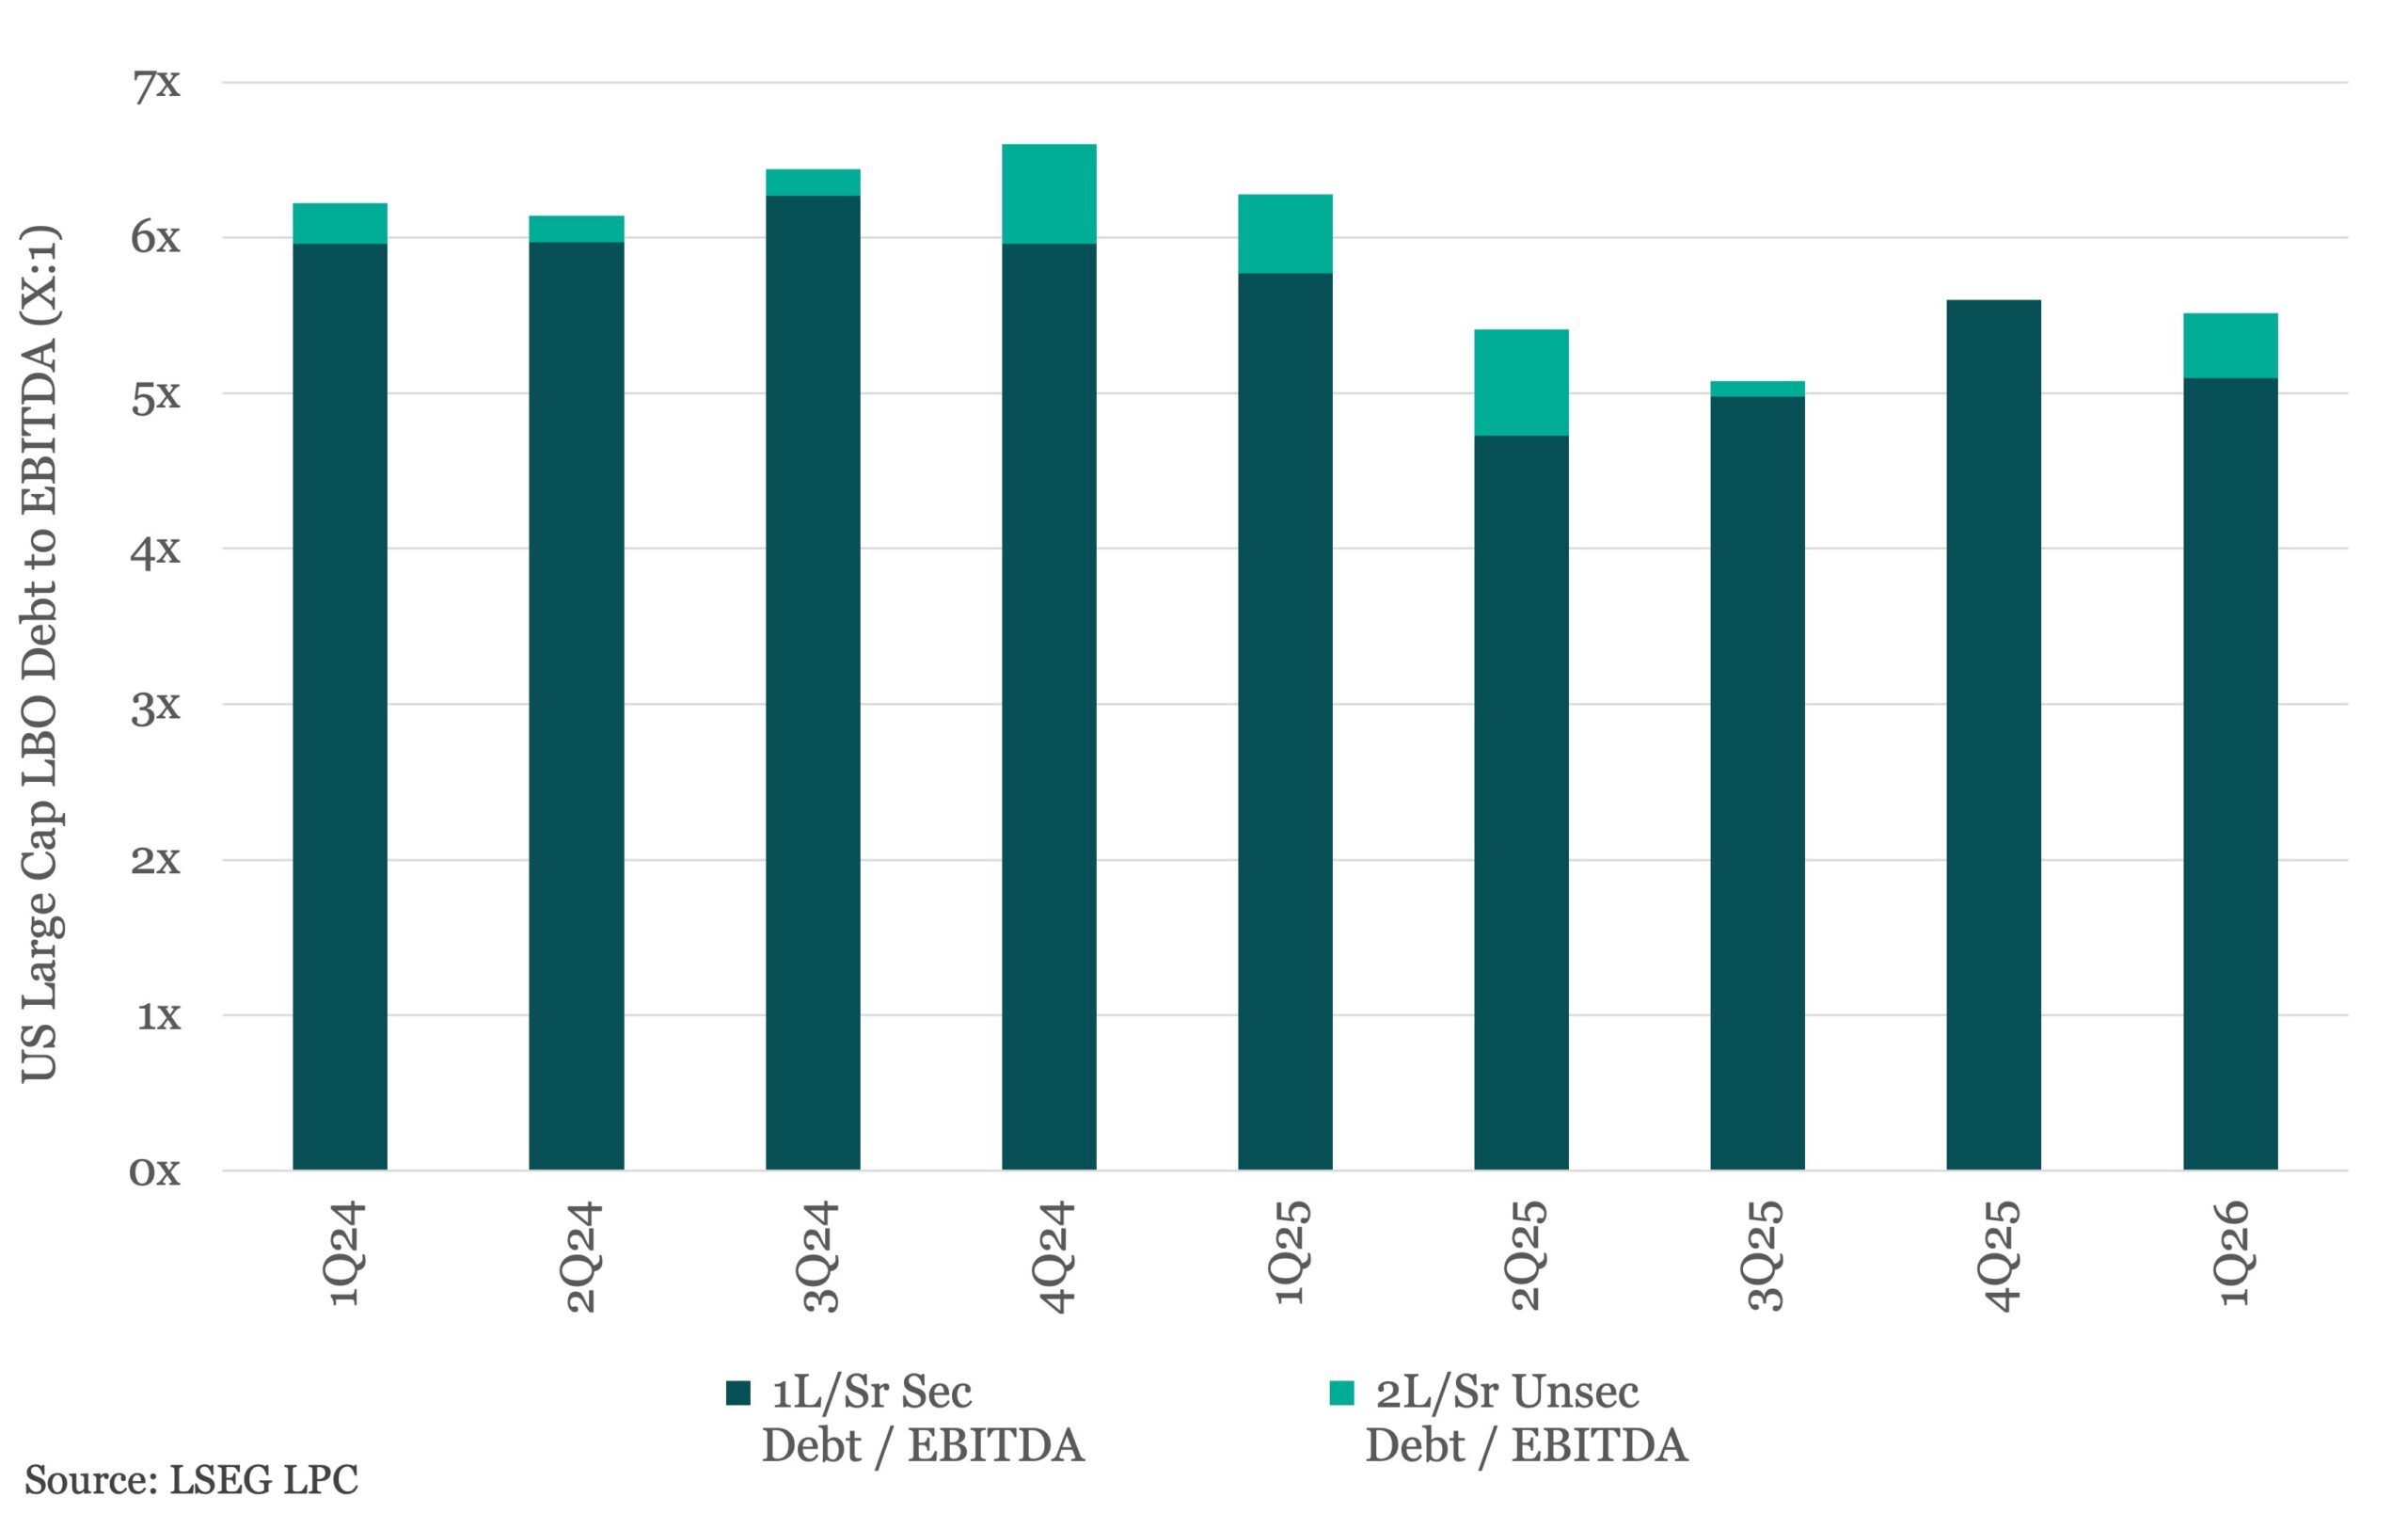
Although leverage multiples on recent large cap LBOs have eased marginally, averaging 5.5x in 1Q26 versus 5.6x in 4Q25, debt composition has shown signs of normalization. Junior-lien and/or unsecured debt accounted for nearly a half turn of leverage in the latest quarter, the largest contribution we’ve seen since 2Q25 and a shift from nonexistence throughout the back half of last year. The majority of buyout financings are still being structured with 100% senior secured first-lien debt supported with substantial equity cushion, although you’re starting to see some privately placed second-lien term loans and unsecured bonds in situations where such paper and economics make sense. That sometimes means rolling existing debt into the new capital structure, as was the case with Select Medical and to a much lesser extent Sealed Air. Electronic Arts was certainly the most notable new raise given its capacity-testing size and cross-border execution ($18bn total funded quantum with 80/20 split between dollars and euros), and provides a great reference point in showcasing relative value across the debt capital structure. The US$6.125bn dollar term loan B (7Y / S+350 / 98.5) printed with a 7.7% yield, or 43bp outside the US$2.875bn senior secured dollar notes (7Y / NC3 / 7.25%), while the US$2.5bn senior unsecured dollar notes (8Y / NC3 / 8.75%) printed 150bp behind the adjoining secured notes.





Latest news

Rate hike expectations ease as term SOFR curve flattens
The CME six-month Term SOFR rate reached a recent high of 3.979% on July 28 before retreating to 3.837% as…

3Q26: New loan assets rise to 44% of total lending, a 3-year high
New loan assets as a proportion of total US loan volume make up 44% of the 3Q26 pipeline to date,…

North American GPs dominant as fundraising accelerates
Our PEI Private Credit 200 ranking also shows capital raising increasing overall – and accelerating especially fast for the largest…