



Arrangers continue to show some discipline with regards to structuring LBO deals as the year comes closer to an end. The share of buyout deals that are levered seven times and greater has fallen to only 14% in 2015, down from 26% last year and down from 39% at the peak of the market in 2007. However sources indicate that arrangers are trying to push leverage as much as they can for their sponsors while still abiding by Leveraged Lending Guidance. 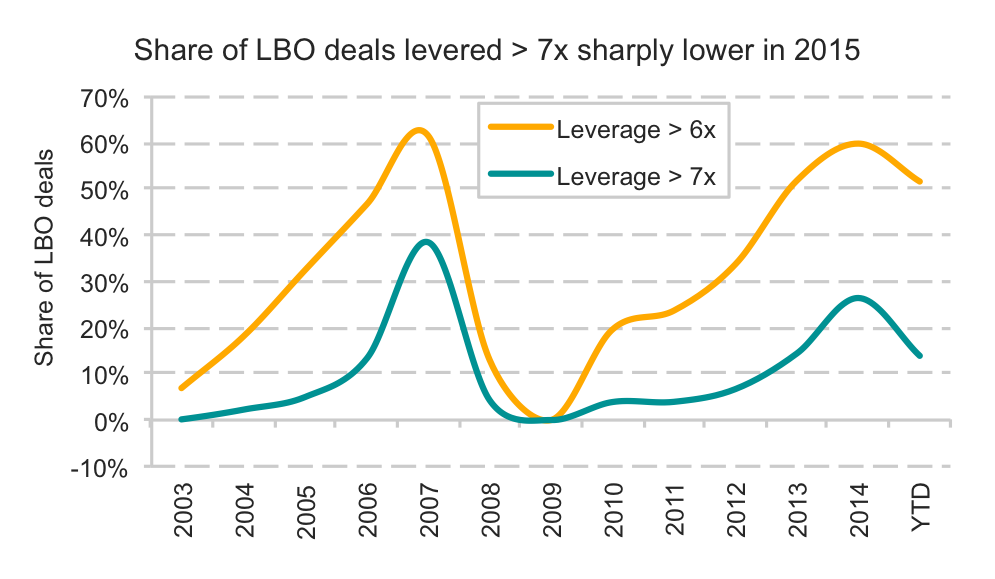 As a result, the share of deals levered six times and greater is still elevated at 52%, down only slightly from the 60% tracked in 2014 and the 62% share tracked at the height of the buyout peak back in 2007. Amid investor selectivity and a volatile market back drop, leverage on large corporate buyout deals have shown a dramatic tightening this quarter. Average leverage is circling around 5.3 times, down from 6.2 times last quarter. Overly aggressive deals have struggled to garner enough investor appetite and have seen significant pushback this quarter.





Latest news

Rate hike expectations ease as term SOFR curve flattens
The CME six-month Term SOFR rate reached a recent high of 3.979% on July 28 before retreating to 3.837% as…

3Q26: New loan assets rise to 44% of total lending, a 3-year high
New loan assets as a proportion of total US loan volume make up 44% of the 3Q26 pipeline to date,…

North American GPs dominant as fundraising accelerates
Our PEI Private Credit 200 ranking also shows capital raising increasing overall – and accelerating especially fast for the largest…