



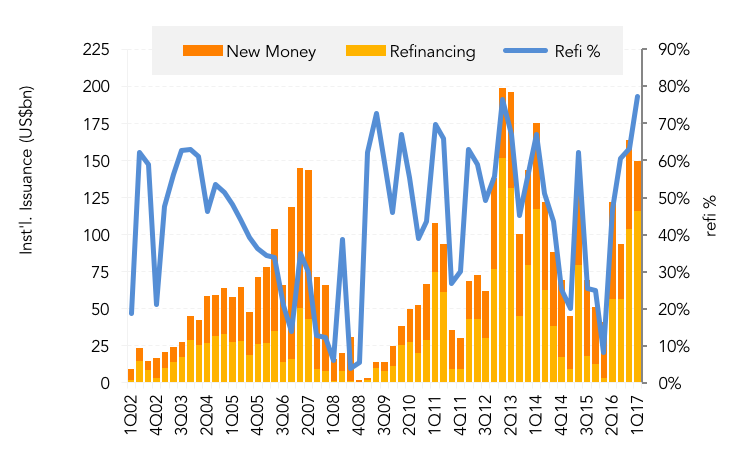
Strong demand for floating rate assets has caused a frenzy in the leveraged loan market this quarter where issuers have been flocking to market to lower the spread on their institutional facilities. This has in turn caused institutional loan volume to spike, reaching US$149.5bn in completed issuance through February 15th. With roughly half a quarter remaining, completed institutional issuance is the fifth highest on record and about US$50bn lower than the US$199bn record set in 1Q13. Breaking down the numbers highlights the refinancing boom. So far this quarter there has been US$115.7bn in institutional refinancing issuance, the fourth highest on record. This repricing wave, coupled with a slower than expected M&A landscape, means refinancings are making up 77% of institutional loan issuance, sneaking past 1Q13’s 76% prior record. It remains to be seen whether refis will approach the quarterly record of US$151bn set in 1Q13.
Looking at the pipeline of institutional deals shows a slowing from over US$100bn just a few weeks ago, to roughly US$53bn currently. Still, that pipeline is well ahead of year-ago levels and should have1Q17 institutional volume near record quarterly levels when all is said and done.
Register to join TRLPC’s 5th Annual Middle Market Loan Conference





Latest news

Rate hike expectations ease as term SOFR curve flattens
The CME six-month Term SOFR rate reached a recent high of 3.979% on July 28 before retreating to 3.837% as…

3Q26: New loan assets rise to 44% of total lending, a 3-year high
New loan assets as a proportion of total US loan volume make up 44% of the 3Q26 pipeline to date,…

North American GPs dominant as fundraising accelerates
Our PEI Private Credit 200 ranking also shows capital raising increasing overall – and accelerating especially fast for the largest…