


Private Debt Intelligence – 10/10/2016

Private Debt Fundraising Remains Low in Q3 2016
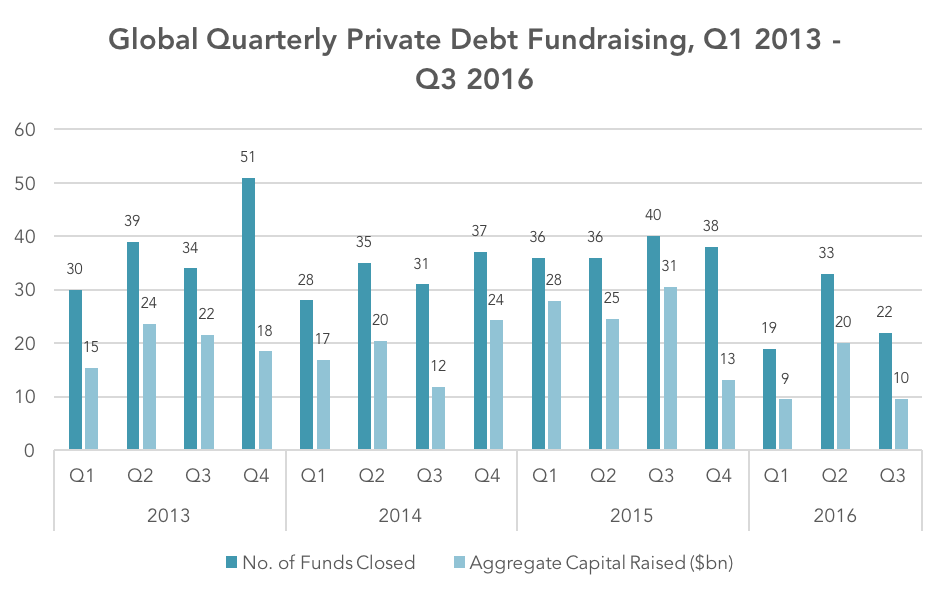
Preqin’s Q3 update on the private debt fundraising market finds that the quarter marked a further slowdown in the levels of capital secured by managers in the space, as 2016 continues to see a far reduced rate in fundraising activity from recent years.
Twenty-two private debt vehicles reached a final close through Q3, raising $9.6bn of investor capital, with Preqin expecting these figures to rise by 10-15% as more information becomes available. This is notably lower than the $20bn raised in Q2 and substantially lower than the $31bn secured in Q3 2015.
North America-focused private debt funds accounted for the majority of activity in Q3 as 12 funds raised $7.7bn, representing 59% of funds closed and 80% of aggregate capital raised globally through the quarter. Europe- and Asia-focused fundraising, however, both suffered a slowdown in activity through the quarter; seven funds targeting investment in Europe closed raising $1.4bn, while just one Asia-focused fund secured $0.5bn of capital commitments.
In terms of strategy, direct lending fundraising declined significantly from $9bn in Q2 to $2bn in Q3. In comparison, distressed debt and mezzanine funds both had a relatively strong quarter securing $4.2bn and $3.9bn in capital commitments respectively.
In addition to the slowdown in private debt fundraising, vehicles are taking longer to reach a final close. In 2016 so far, funds have spent an average of 20 months on the road, four months longer than in 2015 and two months longer than the previous high of 18 months seen in 2011 and 2012.
Although funds may spend longer marketing themselves, there has been a significant uptick in the proportion that exceeded their target size: nearly two-thirds (64%) of funds have raised more than their stated aim so far in 2016, compared with 45% in 2015.
Nonetheless, the fundraising landscape remains intensely competitive at the end of Q3, with 306 funds seeking a combined $147bn of investor capital, which may impact the general length of the fundraising process for many managers. The volume of funds that are coming to market, however, speaks of an optimism that investors are willing to commit to the industry and, as such, fundraising is expected to pick up as the year draws to a close and enters 2017.





Latest news


Software, consumer-related direct lending deals fell in H1'26
The software and technology sector, the second-most-active sector in 2025 at 17% of total deal activity, slid to fifth place in the first half of 2026.

Unconquered Territory
With most of the map still unexplored, there’s room for a sequel.