



Click here to download report.
In the charts that follow, Fitch presents aggregate data for MM companies, defined as in the area of $500 million of debt or $100 million of EBITDA or below, that it privately rates for asset managers.
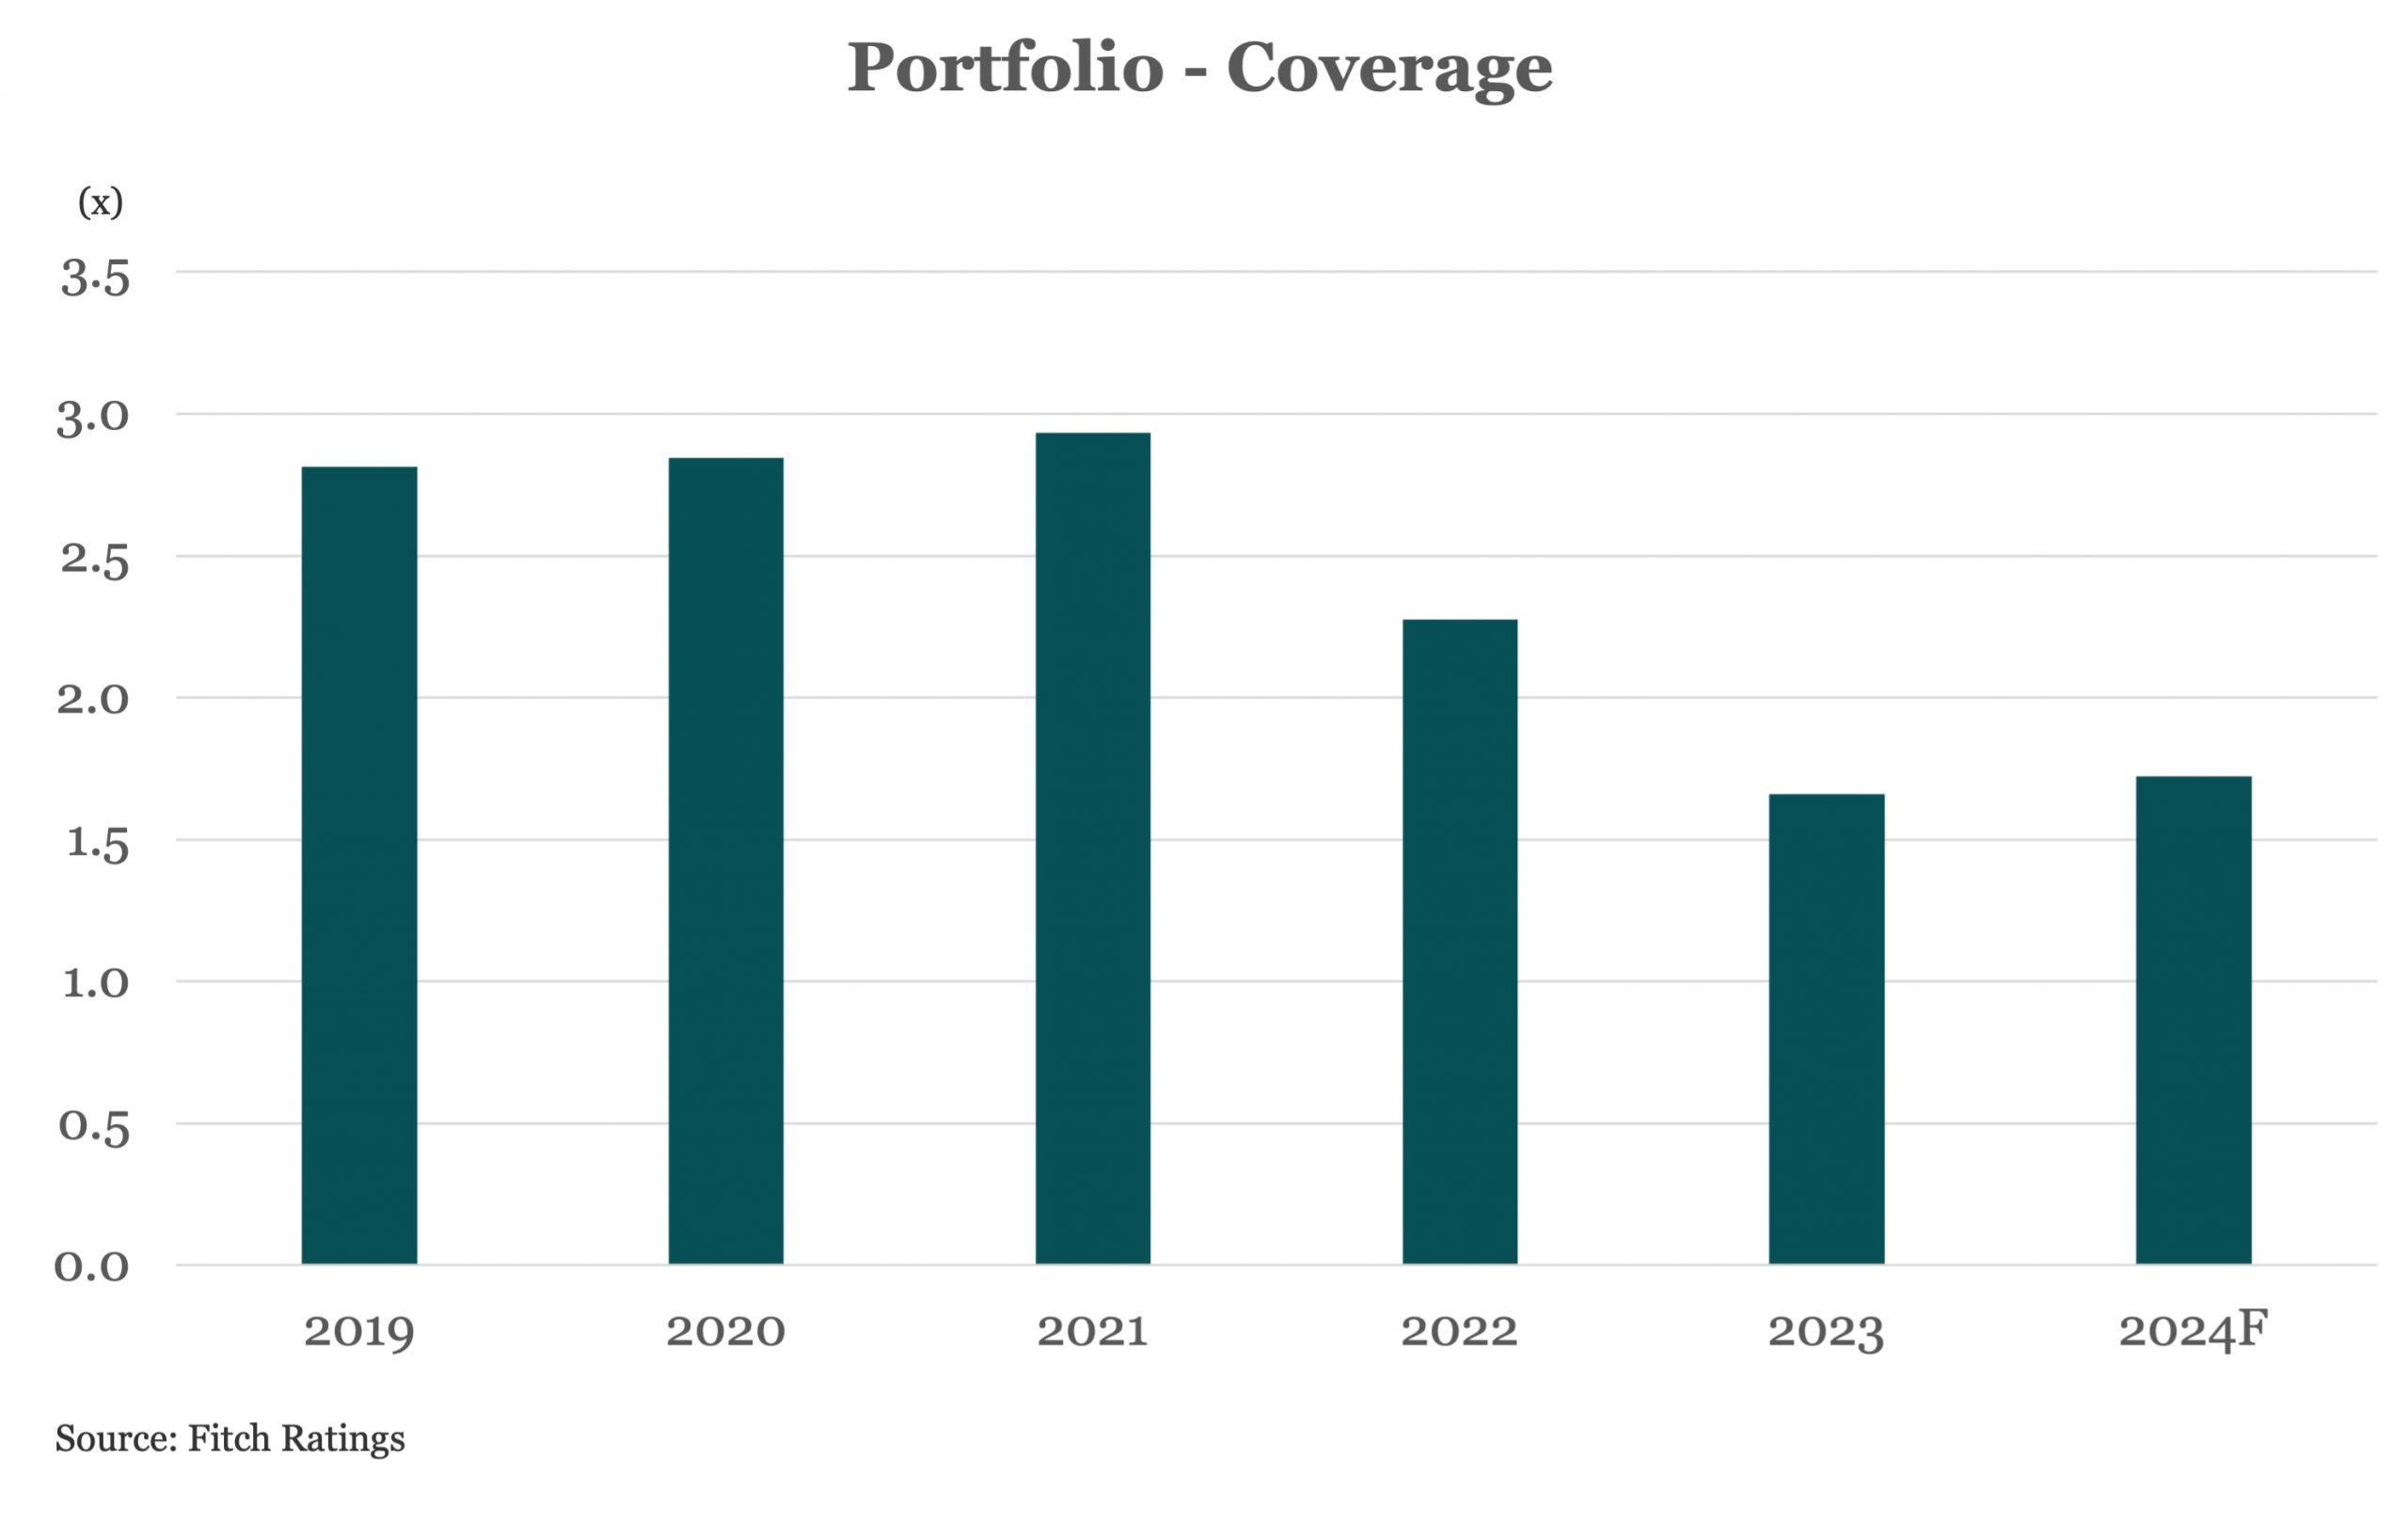
- Fitch forecasts 2024 interest coverage (EBITDA/Interest) to stay flat to 2023 at 1.7x. Despite a respite in spreads this quarter for new issues or for those issuers that refinanced, high all-in interest rates on current capital structures continue to pressure coverage. Corporate analysts focus on interest coverage and FCF as high cash interest payments deplete liquidity for lower-rated issuers. Historically, coverage fluctuated around 2.5x before the Federal Reserve’s tightening cycle, peaking at 2.9x in 2021 and declining to 2.3x in 2022 and further in 2023.
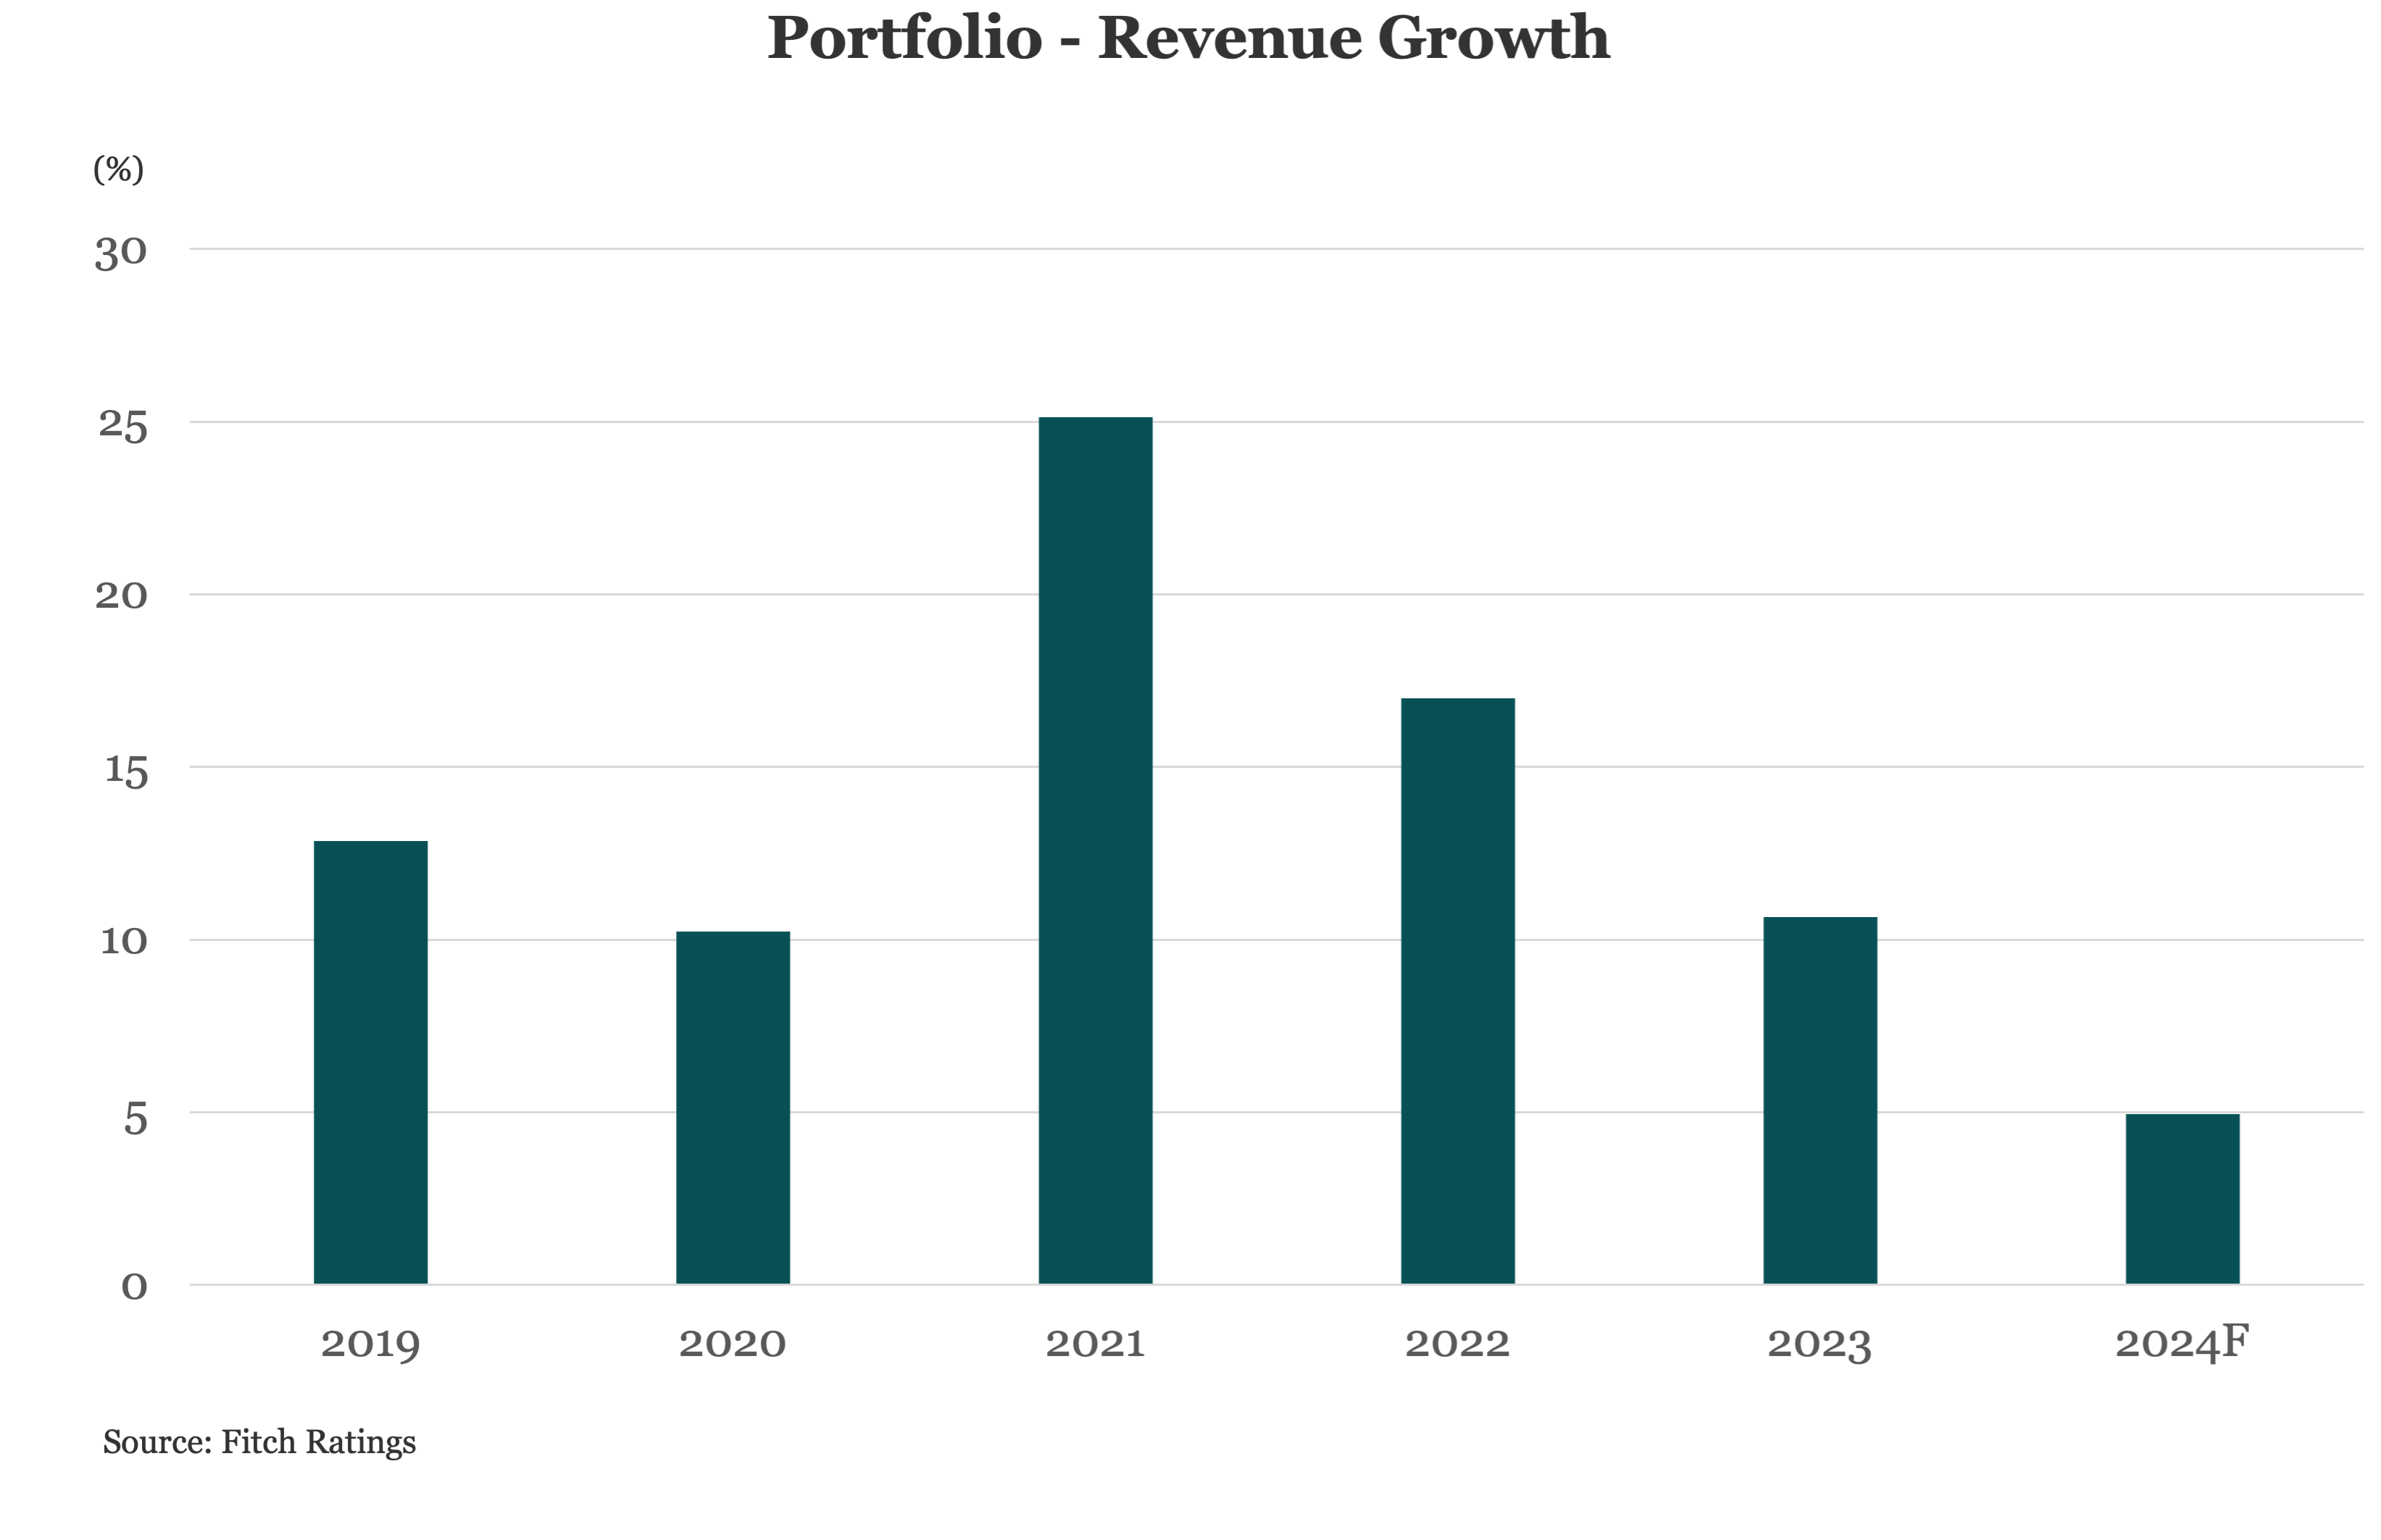
- Fitch forecasts revenue growth of 4.9% in 2024 and low-to-mid single digits annually over the next few years. Both Technology and Diversified Manufacturing sectors lead the portfolio with 8.0% revenue growth projections for 2024. On the other hand, the Consumer segment is projecting the lowest growth at 2.9%. Fitch noted softening consumer tailwinds, continued rebalancing of spend on services instead of goods, and ongoing goods fatigue following strong spending since the onset of the pandemic in its Global Corporates Mid-Year Outlook 2024.
Contact Brad Hamner




Latest news

US Leveraged Loan Launch Activity Moderates in July
July 23, 2026
The US leveraged loan market has recorded $14.01b of new launches through Wednesday, July 22, following $20.91b of issuance the…

US Direct Lending Spread Per Turn of Leverage Widens
July 23, 2026
Wider spreads and slightly lower leverage provided lenders with better risk-adjusted pricing across all deal sizes in the second quarter.

Concentrated Effort
July 22, 2026
Tech deals favored upper end of market, especially in 2021 when software valuations peaked. Source: KBRA DLD Research