



Improved market sentiment boost 2Q16 leveraged market; Opportunistic deals resurface
The market volatility that emerged at the tail end of 2015 and seeped into 1Q16, eased in 2Q – at least until the Brexit vote – allowing lenders to step back to assess their pipelines against the back drop of a stronger high yield bond market. The result? The re-emergence of opportunistic refinancings and dividend recaps as the loan market attempted to play catch up on a slow start to the year. 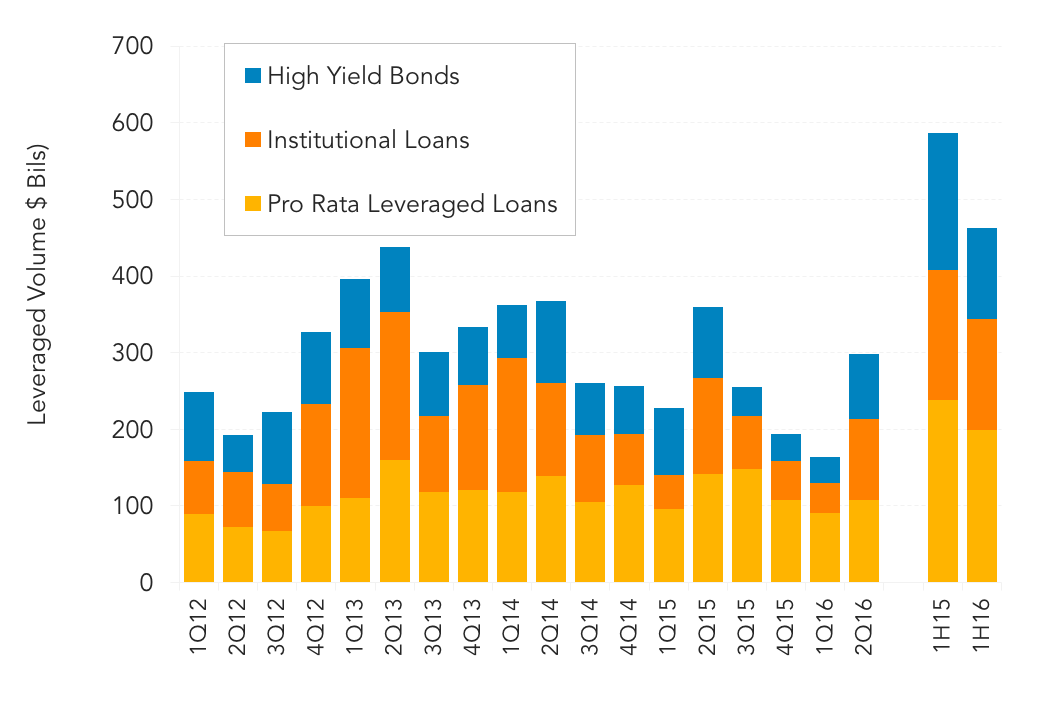 At nearly US$300 billion 2Q16 leveraged issuance was up 81% compared to 1Q16 totals. After several fitful quarters, institutional loan and HY bond investors supported almost $106 billion of institutional loan volume and over US$84 billion of HY bond issuance (as of 6/28/16) the highest quarterly totals in a year. In turn, pro rata lenders – who have proven a steadier source of liquidity among higher quality leveraged credits – pushed over US$108 billion of loan volume through syndication. 1H16 leveraged loan volume totaled nearly US$463 billion of June 28, down 21% year over year due in large part to the slow 1Q16 start. The supply overhang which cast a shadow on the market was largley cleared and lenders noted the development of a more balanced, albeit slower, calendar. Despite some 2Q market bullishness that precipitated a series of opportunistic refinancings and repricings, lender fatigue settled in fairly quickly. Several lenders noted that deals that got caught at the end of the repricing cycle got done, but with greater than expected difficulty.





Latest news


Software, consumer-related direct lending deals fell in H1'26
The software and technology sector, the second-most-active sector in 2025 at 17% of total deal activity, slid to fifth place in the first half of 2026.

Unconquered Territory
With most of the map still unexplored, there’s room for a sequel.