


Leverage on institutional middle market deals climbs on new money deals in 1Q17

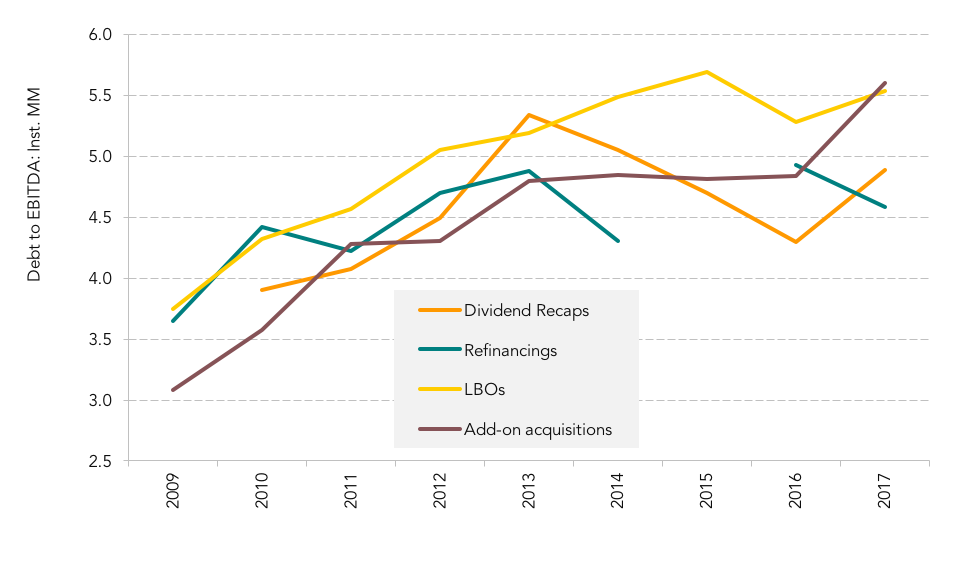
Interest in middle market loans from large corporate investors tends to wax and wane based on market conditions, but currently investors are super receptive to these smaller credits given a supply demand imbalance in the leveraged loan market. As a result, leverage levels on institutional middle market deals are rising in 2017 across most deal purposes. Leveage on dividend recap deals peaked in 2013 at 5.3 times and was in decline through 2016 down to 4.3 times as large corporate buyers were less willing to stretch on smaller credits. However, in 1Q17 the figure has begun to climb again and is averaging 4.9 times so far as CLOs and other larger investors hunt for yield and snap up larger middle market credits with ratings. This trend is also clear on institutional middle market LBOs and add-on acquisitions. In fact, leverage of 5.6 times on add-on acquisition financings is at the highest level post credit crisis since LPC began tracking these figures. The average leverage level on institutional middle market LBOs has crept up to 5.5 times in 1Q17, up from 5.3 times last year, but still slightly below the peak tracked in 2015 of 5.7 times. Deals hitting the market for refinancings seem to have the lowest average leverage levels at just 4.6 times and this is the only deal purpose with lower leverage levels compared to 2016. While this stat has stayed relatively conservative relative to M&A deals, issuers are getting covenant-lite structures on some of these refinancings so buyers beware.
Register to join TRLPC’s 5th Annual Middle Market Loan Conference





Latest news


Software, consumer-related direct lending deals fell in H1'26
The software and technology sector, the second-most-active sector in 2025 at 17% of total deal activity, slid to fifth place in the first half of 2026.

Unconquered Territory
With most of the map still unexplored, there’s room for a sequel.