


Evolution of leveraged loans by vintage shows notable reductions in near-term maturity walls

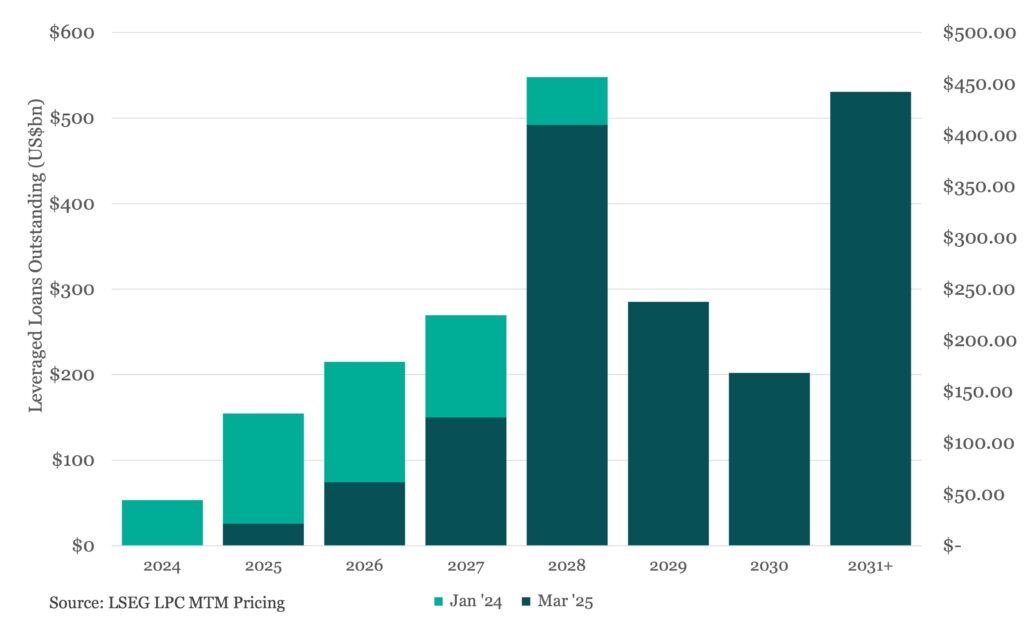
Leveraged loan issuers have continued to proactively manage their capital structures via refinancings and extensions, driving significant reductions in near-term maturity walls over the past 15 months. Since January ’24, more than 50% of leveraged loans maturing through ’28 have been repaid, refinanced, or extended. And during that same timeframe, the percentage of loans maturing in ’28 and beyond has expanded from 35% to approximately 50%. The current maturity wall has eroded almost completely, with only US$21.3bn set to mature by year end, down 86% since the beginning of ’24. Loan outstandings due in ’26 and ’27 also show meaningful progress, having dropped 71% and 54%, respectively. And although issuers have chipped away at their ’28 maturities, which have fallen 25% to US$410bn or nearly 30% of total outstandings, ’28 remains the peak maturity wall for the leveraged loan market. Looking even further out, the ‘31 vintage comes in close second at US$356bn, thanks to record issuance levels from ’24. Worth noting that total outstandings, or the overall size of the leveraged loan market, defined here as actively quoted US secondary loans paying cash interest, has also declined by US$100bn to approximately US$1.4trn.




Latest news

US Leveraged Loan Launch Activity Moderates in July
The US leveraged loan market has recorded $14.01b of new launches through Wednesday, July 22, following $20.91b of issuance the…

US Direct Lending Spread Per Turn of Leverage Widens
Wider spreads and slightly lower leverage provided lenders with better risk-adjusted pricing across all deal sizes in the second quarter.

Concentrated Effort
Tech deals favored upper end of market, especially in 2021 when software valuations peaked. Source: KBRA DLD Research