


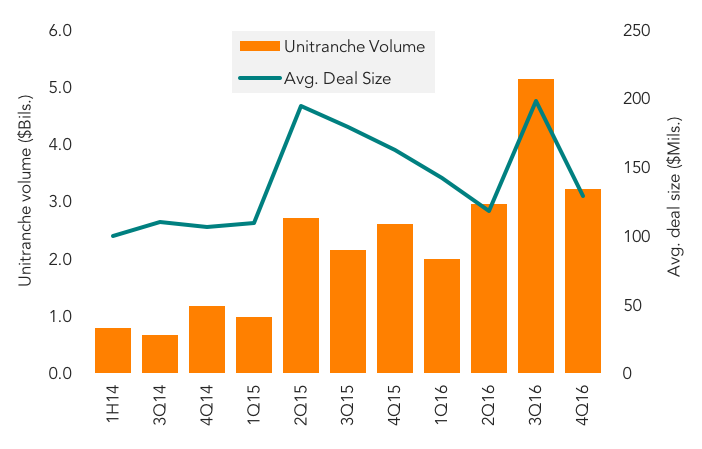
Unitranche volume grows while deal sizes get bigger

LSEG (1)
Content hub / Article / LSEG / Unitranche volume grows while deal sizes get bigger

Jan 23 2017 TR

As money continues to pour into the middle market searching for yield, the unitranche structure continues to gain traction.  Unitranche volume reached US$13.3bn in 2016, up from US$8.5bn in 2015.  Bigger deals were seen in 2016 as more and more lenders continued to build scale and increase their hold size.  The average deal size was $198M in 3Q16 and $129M in 4Q16.  But 50% of unitranches continue to be in the $0-$100M deal size area.  With more and more players offering the product and with second lien yields declinining in the second half of 2016, yields on unitranches contracted in 4Q16 to 8.38% from 8.74% in 3Q16.  Spreads on select deals were as low as 575bps-600bps on a blended basis in 4Q16. Unitranche continues to be appealing to sponsors looking to acquire companies in situations where they want to minimize flex risk, execution risk and close swiftly.  Since 2014, 70% of all unitranches tracked by LPC have been for M&A purposes while only 13% were for dividend recaps and only 18% were for corporate purposes/refinancings.   With the institutional market very strong in 1Q17, time will tell if sponsors will continue to pay up for the unitranche structure this year or hit up the syndicated market instead to obtain lower pricing and looser structures.

Contact: Frances Beyers
frances.beyers@tr.com

Business development companies and the rise of balance sheet financing vehicles

Podcast

Business development companies and the rise of balance sheet financing vehicles

Fitch's Deb Murnin and Chelsea Richardson discuss the growing use of off-balance-sheet JVs and finance companies among BDCs, exploring the drivers, leverage impacts, portfolio risk profiles, and potential rating implications for Fitch-rated BDCs.
Listen
Private Debt Investor New York Forum

September 15-16, Hudson Yards, New York

Private Debt Investor New York Forum

Bringing together the investors, managers and advisers shaping the next phase of the market — 200+ allocators and $10.6 trillion of LP capital expected. Benchmark strategies, hear from leading LPs, and cut through market noise over two unmissable days.
Learn more
US Private Credit League Tables H1'26

Report

US Private Credit League Tables H1'26

The definitive rankings covering private credit activity in H1'26.
Download
PitchBook's Q2 2026 US PE Breakdown

Report

PitchBook's Q2 2026 US PE Breakdown

Software freezes and energy powers on as US PE deal value falls 38% in Q2 2026.
Download
Making sense of private credit defaults

Webinar

Making sense of private credit defaults

What does private credit default data really tell us? Join our exclusive webinar featuring experts from KBRA, Moody's, Fitch Ratings, and S&P Global to find out.
Register

Latest news

    High-Yield Bond Statistics

    Read More

    Software, consumer-related direct lending deals fell in H1'26

    The software and technology sector, the second-most-active sector in 2025 at 17% of total deal activity, slid to fifth place in the first half of 2026.

    Read More

    Unconquered Territory

    With most of the map still unexplored, there’s room for a sequel.

    Read More





