


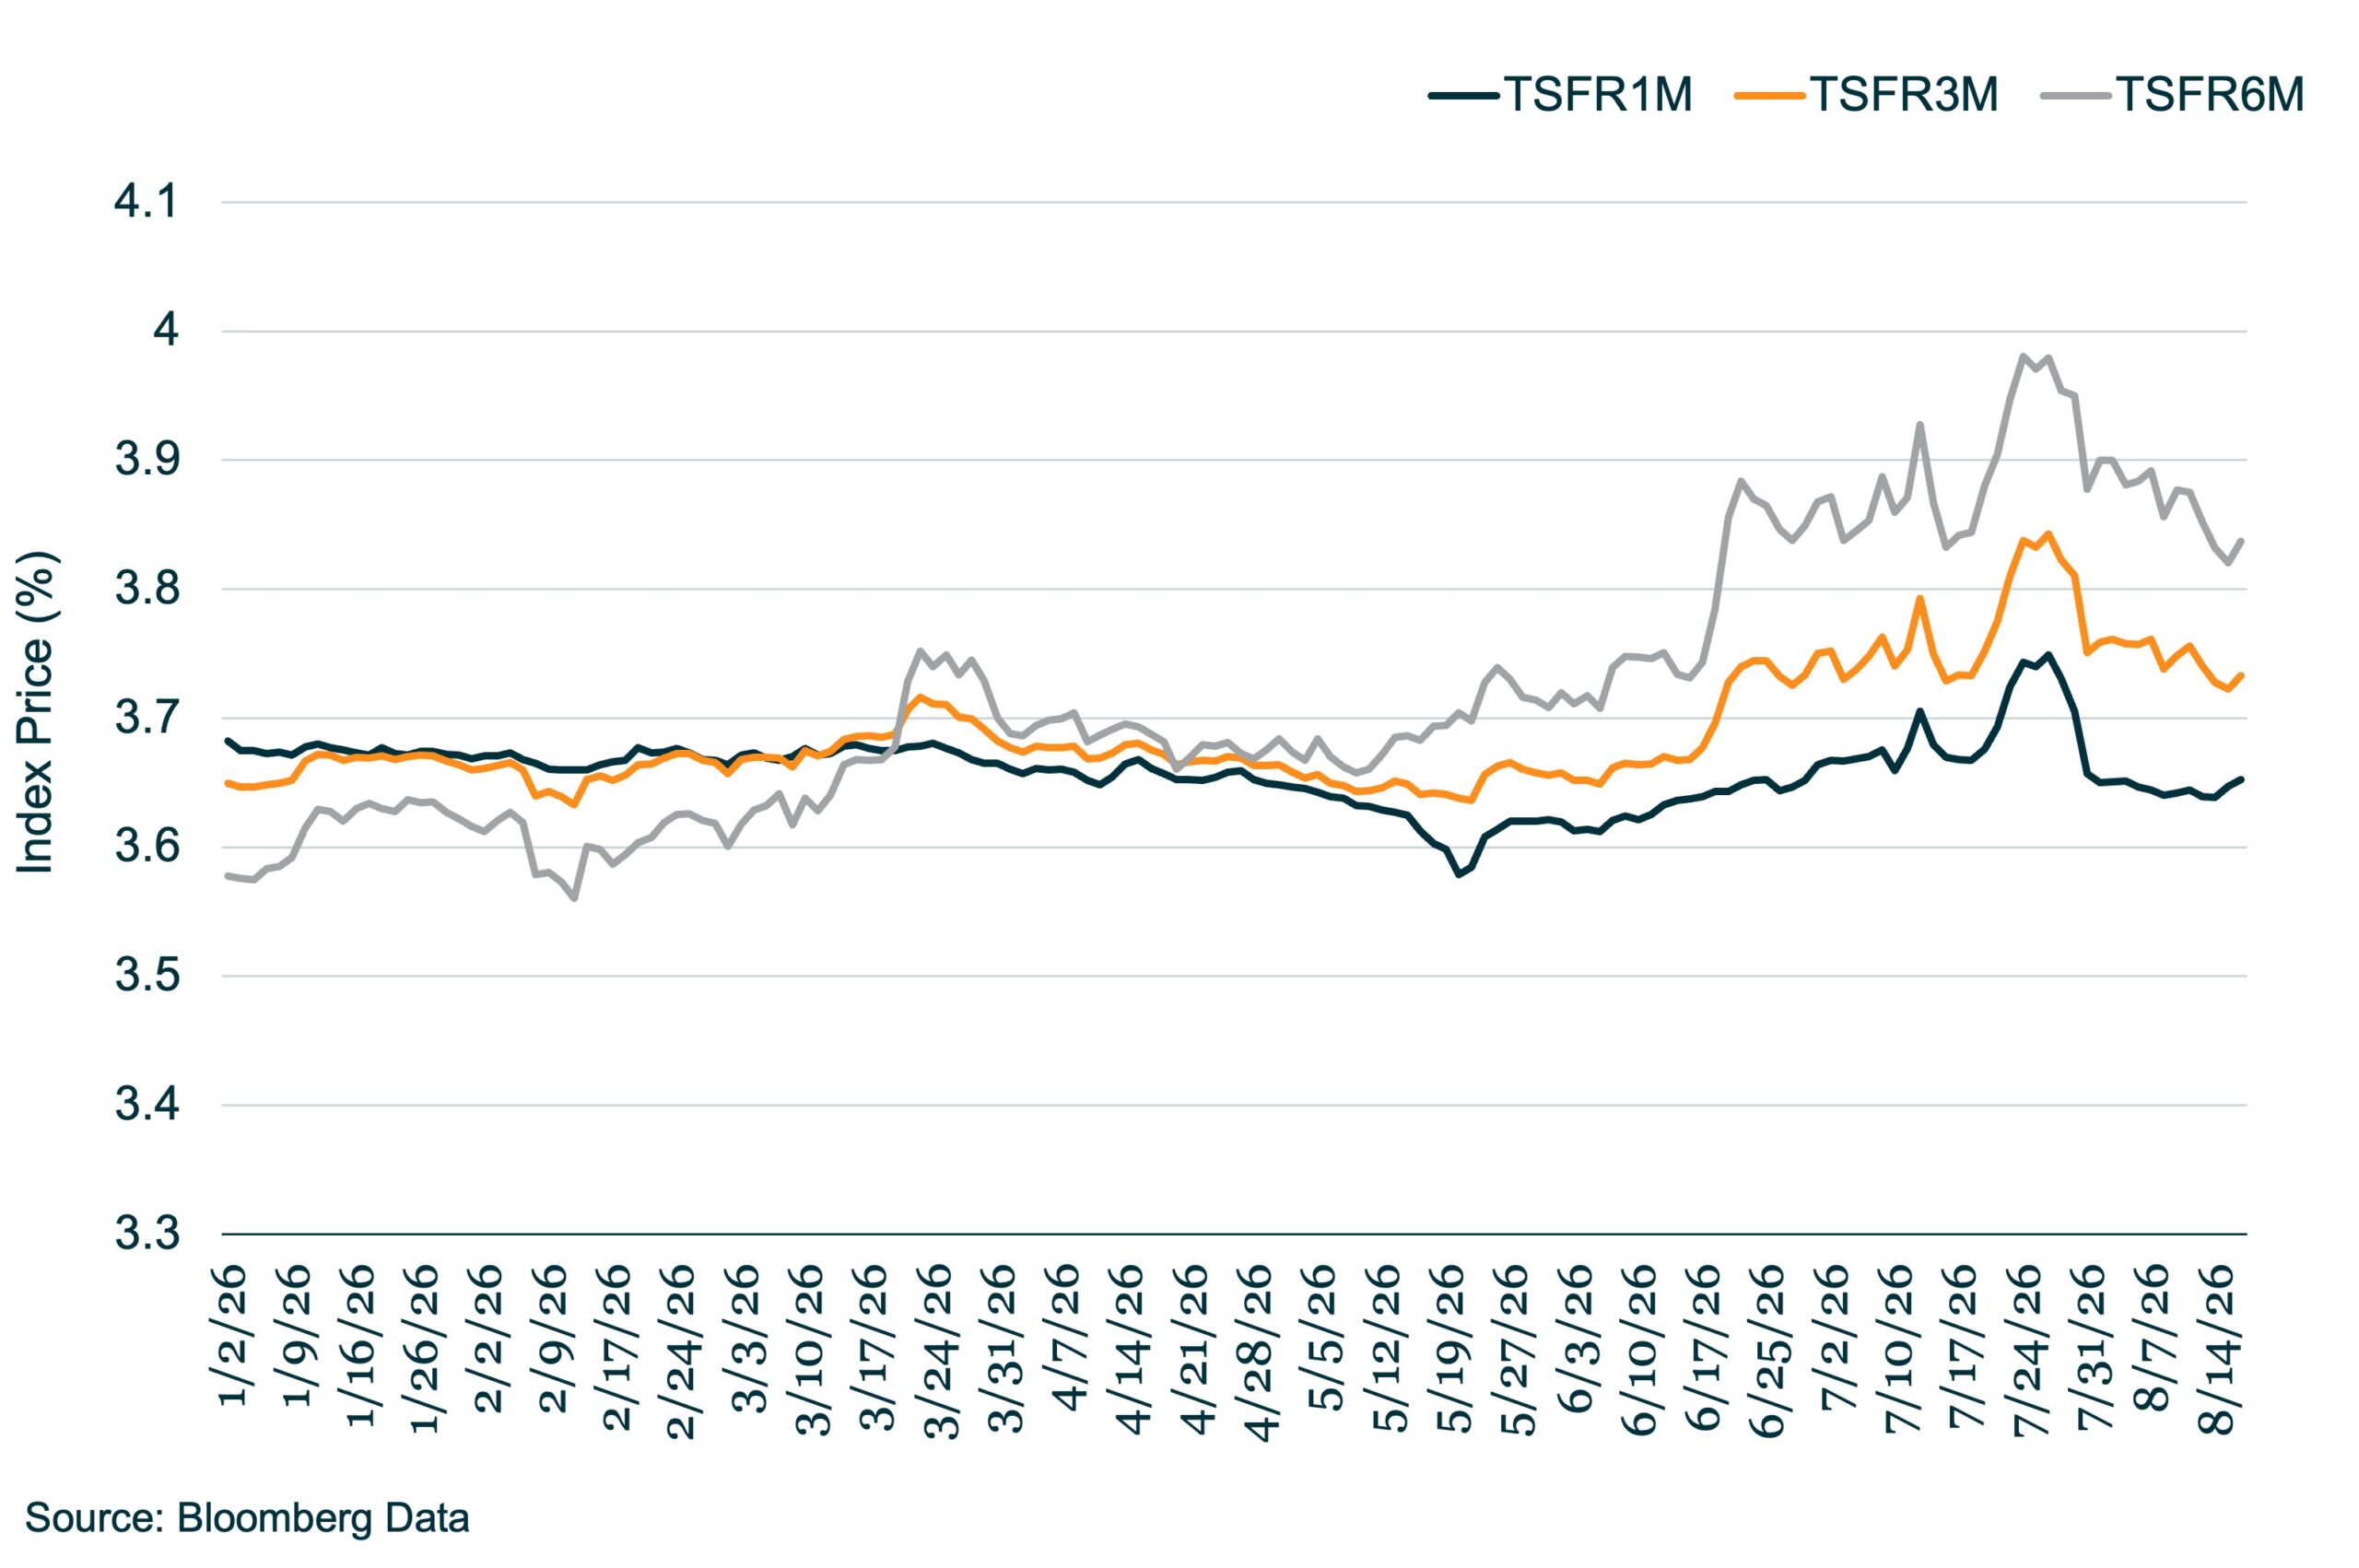
The CME six-month Term SOFR rate reached a recent high of 3.979% on July 28 before retreating to 3.837% as of August 18. Over the same period, the six-month premium over one-month Term SOFR narrowed from a high of 25 basis points to 18bps. The move suggests that while investors have scaled back expectations for a Federal Funds Rate increase over the next six months, the market continues to price in a higher-for-longer rate environment, with limited expectations for near-term cuts.
Following the Federal Open Market Committee meeting on July 29, six-month Term SOFR declined by approximately 10bps over the subsequent three sessions. The rate fell another 5bps following the weaker-than-expected August 7 employment report, further tempering expectations for tighter monetary policy.
The shift in rate expectations has been significant since the beginning of the year. In January, one-month Term SOFR traded at a 10.5 basis point premium to the six-month benchmark, reflecting expectations that the Federal Reserve would continue easing monetary policy. That dynamic reversed on March 19, when the curve inverted and six-month Term SOFR moved to a premium over the one-month rate, signaling a meaningful shift toward a more hawkish outlook. That hawkishness intensified through the summer before peaking in late July.





Latest news

3Q26 New loan assets as proportion of total lending edge up to 44%, highest level in 3 years
New loan assets as a proportion of total US loan volume make up 44% of the 3Q26 pipeline to date,…

North American GPs dominant as fundraising accelerates
Our PEI Private Credit 200 ranking also shows capital raising increasing overall – and accelerating especially fast for the largest…

PE exit activity
Exit value fell to $102.6 billion in the second quarter—down 46.3% from the prior quarter and 7.4% YoY—while exit count dropped to 353, a 14.1% quarterly decline and a 5.4% rise against Q2 2025.