



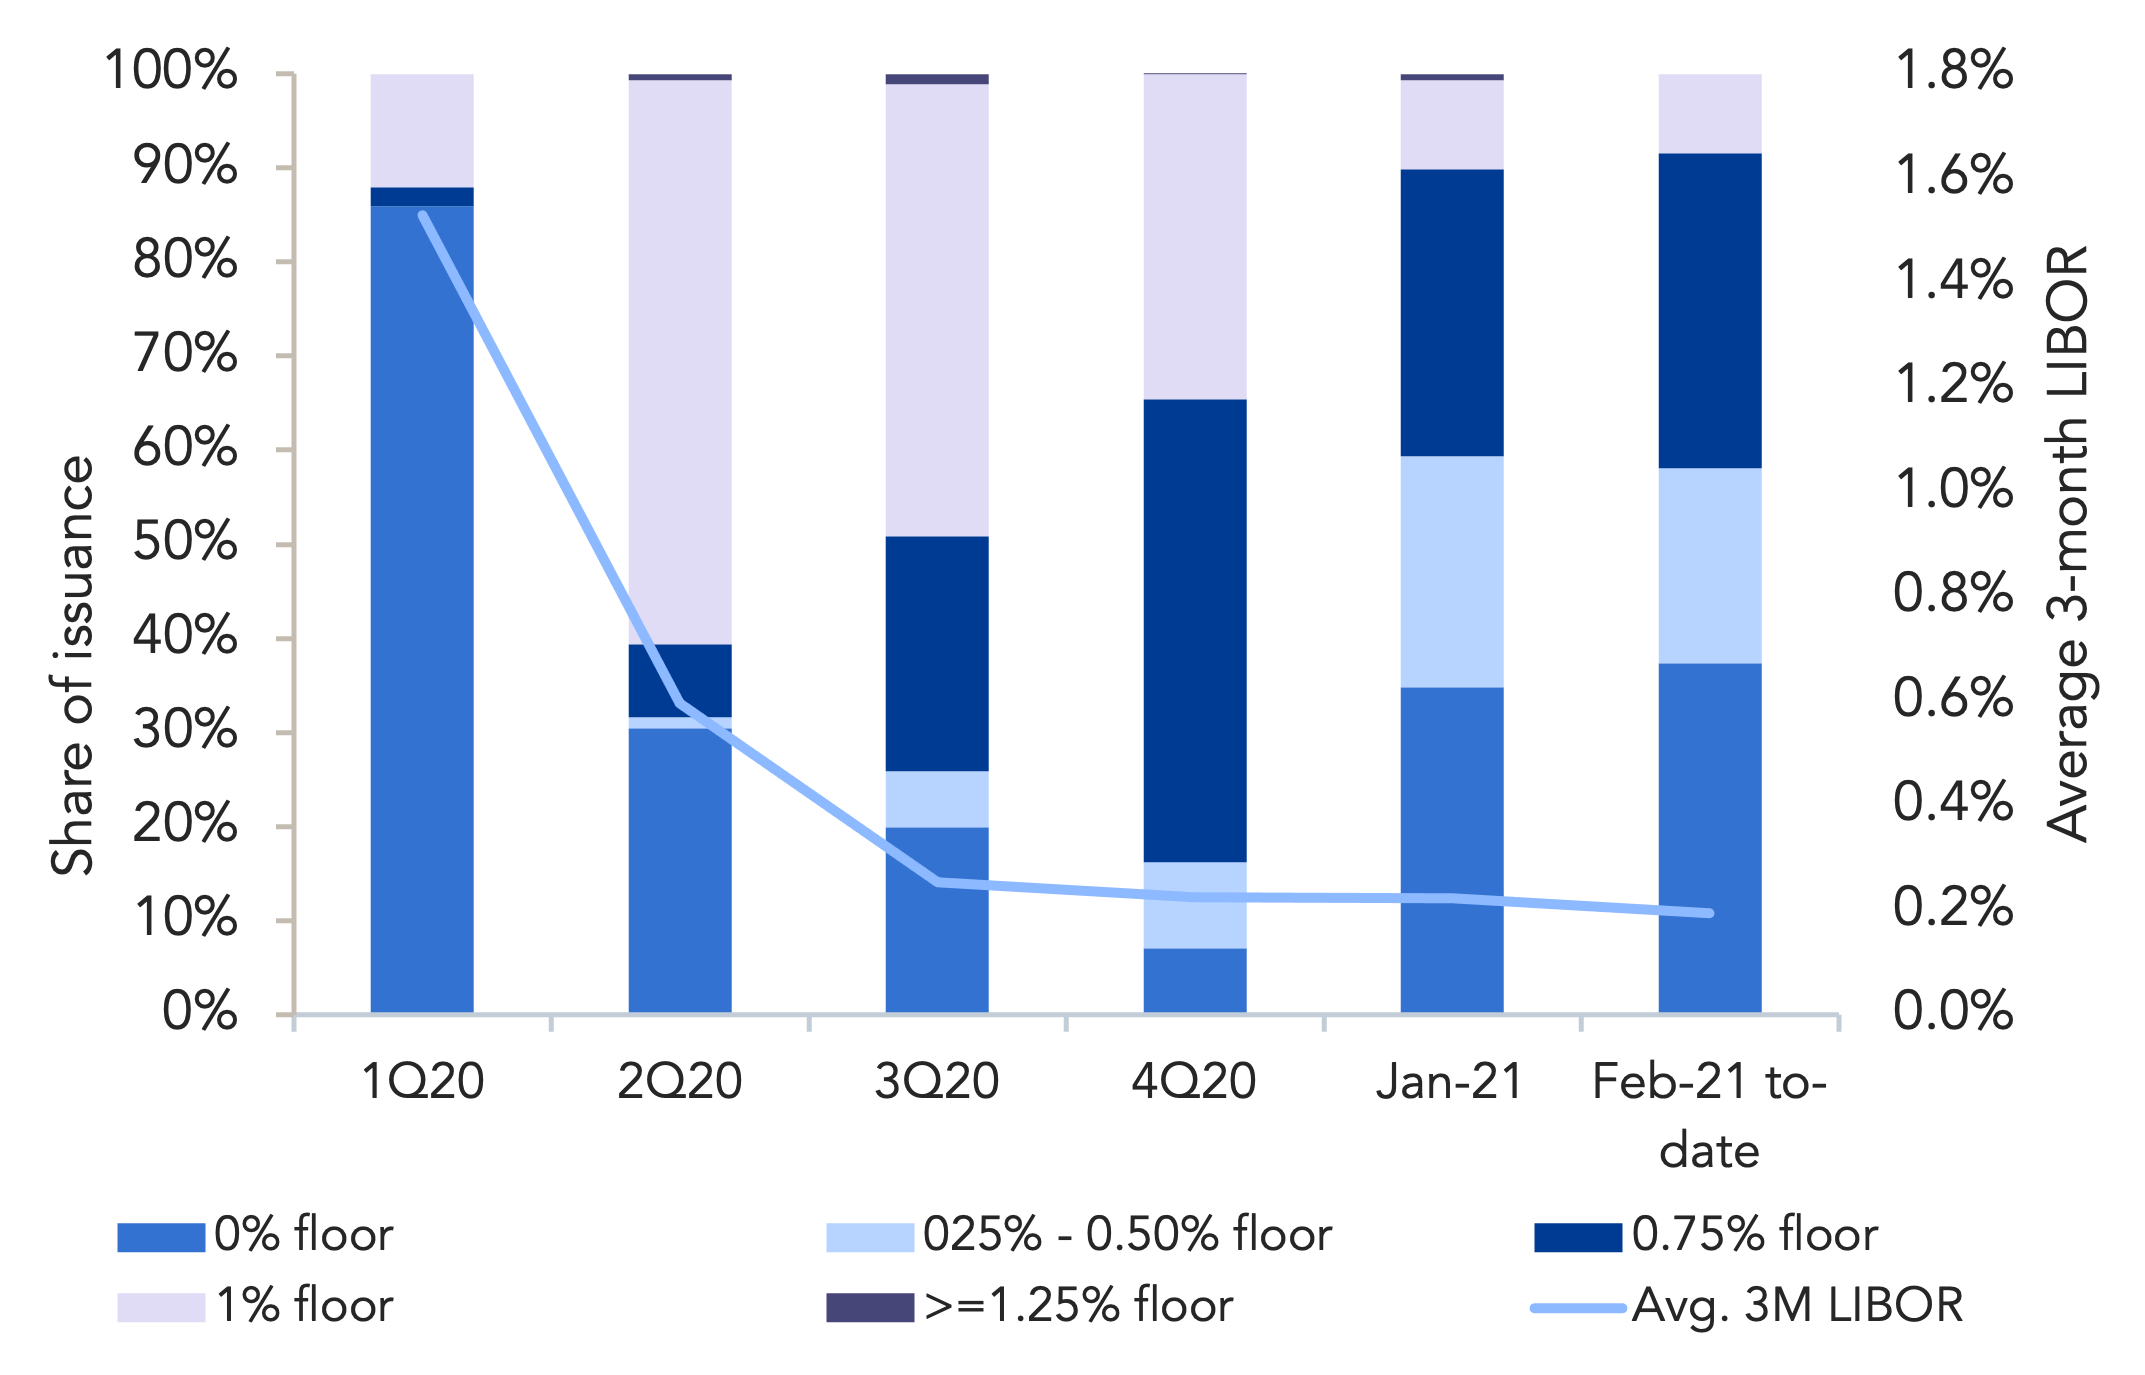
Source: Debtwire Par
The percentage of loans issued with a 1% LIBOR floor or greater has continued to decline, driven in no small part by the wave of repricings hitting the loan market this year – loan repricings have made up a whopping 49% of the USD 165.3bn institutional issuance year-to-date. Amid the deluge of repricings, many borrowers have sought to reduce their LIBOR floors, a reversal from last year when LIBOR floor levels climbed in conjunction with the plunge in three-month LIBOR figures, which have decreased from an average of 1.82% in January of last year to the current figure of just 0.19%. In turn, the percentage of loans issued with a 0bps floor has increased to 36% in 1Q21 to-date from just 7% in the fourth quarter of last year. In contrast, 1% floors have become scarce, accounting for just 9% of issuance compared to 35% of issuance in the fourth quarter.
Companies such as Ascend Performance Materials used the opportunity to reprice its USD 1.086bn TLB due 2026, reducing the margin 50bps to LIBOR+ 475bps and shaving an additional 25bps off the floor, which landed at 75bps. Tosca Services similarly cut 50bps from the margin of its USD 526.5m TLB due 2027 and an additional 25bps from the floor, with pricing finalized at L+ 350bps and a 75bps floor. Both deals were issued at par.
In some instances, borrowers were able to negotiate tighter floors during the syndication process. Dell Technologies, for example finalized a repricing of its USD 3.143bn TLB due 2025 at L+ 175bps with a 25bps floor, having tightened from talk of L+ 175bps and a 50bps floor.
While floors have continued to decrease on average, investors have been eager to lock in yield and defend against further erosion of the three-month LIBOR rate, as evidenced by the prevalence of 50bps and 75bps floors (21% and 33% of February issuance, respectively). As such, while the average floor has decreased to 42bps from the high of 75bps seen in 4Q20, it remains well above the 13bps average seen in the first quarter of last year when 0bps floors accounted for 86% of the market.





Latest news

Multiples on PE buyouts
This quarter marks our integration of SPI by StepStone as the primary source for US buyout valuation metrics for the PE Breakdown.

US Leveraged Loan Issuance Slows to $76.5b in July
The US leveraged loan market has continued to slow from the May level of $104.7b, with approximately $76.5b priced in…
