



At $2.1 trillion in 2014, overall U.S. syndicated lending was just shy of 2013’s $2.14 trillion record. M&A-related financings, at $457 billion, were up 27 percent from 2013 and approaching 2007’s $471 billion record. Including financings for Burger King and Community Health Systems, leveraged M&A activity reached $267 billion, up 21 percent from 2013 and ranking only below 2007’s record of $357 billion. 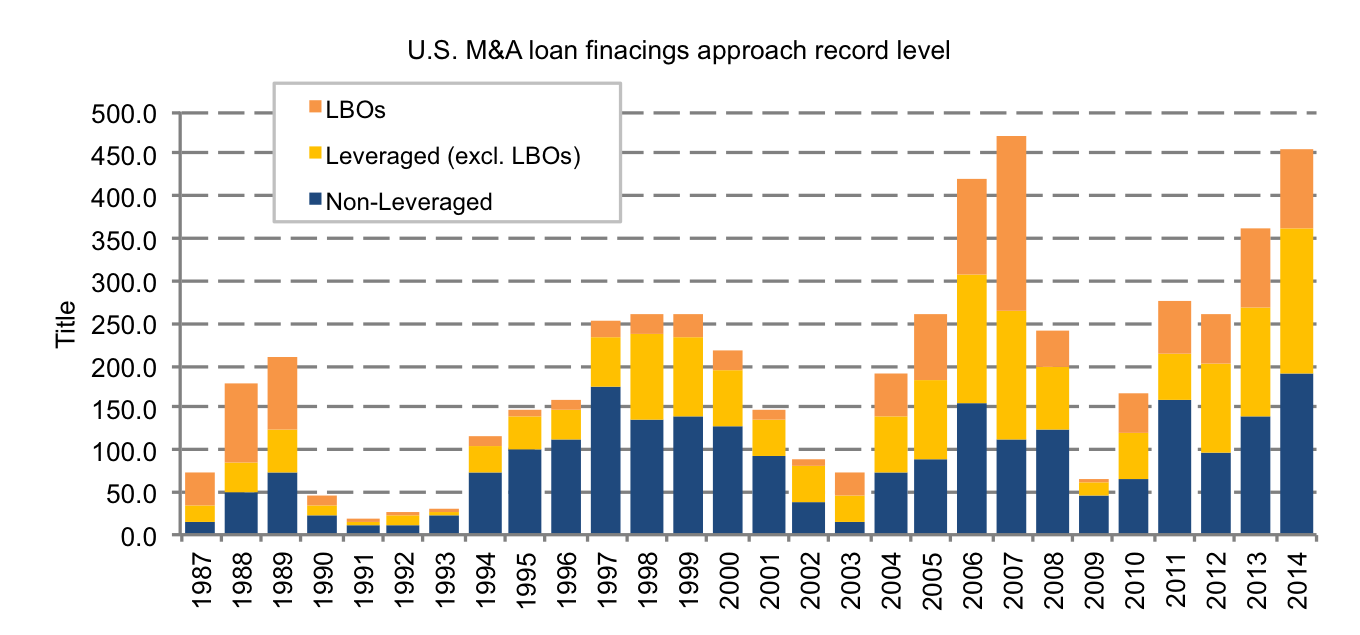 In 2007, LBO financings reached $207 billion compared to this year’s $92 billion. Instead, corporates in the leveraged space borrowed $116 billion to back M&A transactions in 2014, up 31 percent from 2013. Meanwhile, investment grade M&A financings reached an all-time record of $174 billion in 2014, driven by Actavis Plc’s more than $37 billion financing backing its acquisition of Allergan Inc. and also including Medtronic Inc.’s $16 billion financing backing its acquisition of Covidien Plc, Zimmer’s $12 billion in credit facilities partly backing its acquisition of Biomet Inc. and loans for Becton Dickinson & Co, Reynolds, Halliburton, Tyson Foods and others. Underliers





Latest news

Rate hike expectations ease as term SOFR curve flattens
The CME six-month Term SOFR rate reached a recent high of 3.979% on July 28 before retreating to 3.837% as…

3Q26: New loan assets rise to 44% of total lending, a 3-year high
New loan assets as a proportion of total US loan volume make up 44% of the 3Q26 pipeline to date,…

North American GPs dominant as fundraising accelerates
Our PEI Private Credit 200 ranking also shows capital raising increasing overall – and accelerating especially fast for the largest…