


Private Debt Intelligence – 3/20/2017

Private Debt Fund Performance by Strategy
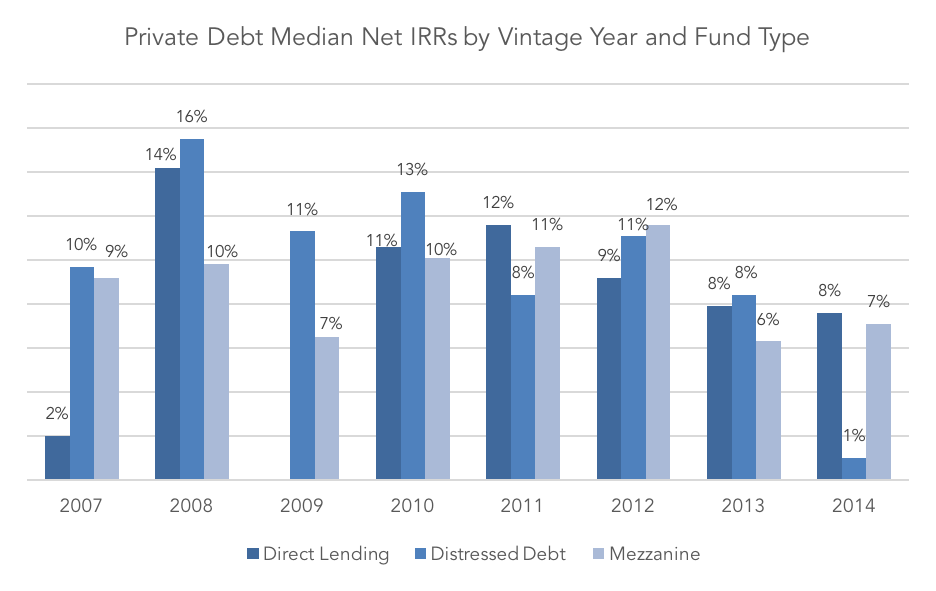
The private debt asset class has continued to satisfy institutional investors with 93% of those surveyed by Preqin at the end of 2016 stating that the performance of their private debt investments had either met or exceeded expectation. However, performance as measured by the median net IRR of funds varies notably across the three central private debt strategies: direct lending, mezzanine and distressed debt.
Since 2008, investors have been increasingly attracted to direct lending’s fixed income-style product and coupon-based payment structure. The strategy recorded double-digit median net IRRs for vintage years 2008-2011 with 14% returned by 2008 vintage marking a high. For the more recent vintage funds (2012-2014) with IRRs of 8-9% for vintage years Preqin would expect these figures to rise as the vehicles mature and begin to see returns on their deployed capital. Mezzanine vehicles of recent vintages have shown relatively modest risk-adjusted returns in comparison with other alternatives strategies, typical of their lower risk/return profile: they average a median net IRR of 9.0% and a standard deviation of 5.2% for vintages 2004-2014.
Distressed debt funds have seen a higher median net IRR than mezzanine or direct lending funds among fund vintages 2004-2014, while standard deviation has also remained the highest of the three central private lending categories. As at June 2016, median net IRRs for distressed debt funds with vintage years 2007-2014 have fallen within a 15-point range between 1.0% (vintage 2014) and 16% (vintage 2008). Across the same vintage years, direct lending and mezzanine funds’ net IRRs have fallen within 12 and six percentage points respectively.
Private debt had its strongest return over the five years to June 2016 and outperformed the S&P Index over three and five years, but produced lower returns than both private equity and private capital over all periods shown on a non-risk-adjusted basis. Current signals indicate that the asset class will continue to be able to deliver the performance sought by investors which points towards further expansion as an increasingly mainstream component of investor portfolios over 2017.





Latest news


Multiples on PE buyouts
Median net debt/EBITDA across the market stood at 4.7x in 2025, and although it bottomed near 4x in 2023 before recovering, it remains below the 5.2x reached in 2021…

BDC redemption requests remain elevated but show some signs of stabilization*
Looking at the 12 largest BDCs that offer investors the ability to redeem shares on a quarterly basis, redemption requests…